Auto Fib Retracement
Fibonacci retracement levels of the latest confirmed swing, with a swing size that scales with volatility, and optional extensions beyond the swing.
- Auto Fib
- Built into Spectral
- Updates at bar close
- fibonacci
- retracement
- extensions
- swing
- support resistance
- auto fib
MIT-0: free to use, change and share, no attribution needed. What you build from it is yours.
Already in Spectral: add it from the Indicators toolbox. The file here is the same indicator written as a custom indicator, to change or learn from. Installed, it appears next to the built-in one, marked Custom.
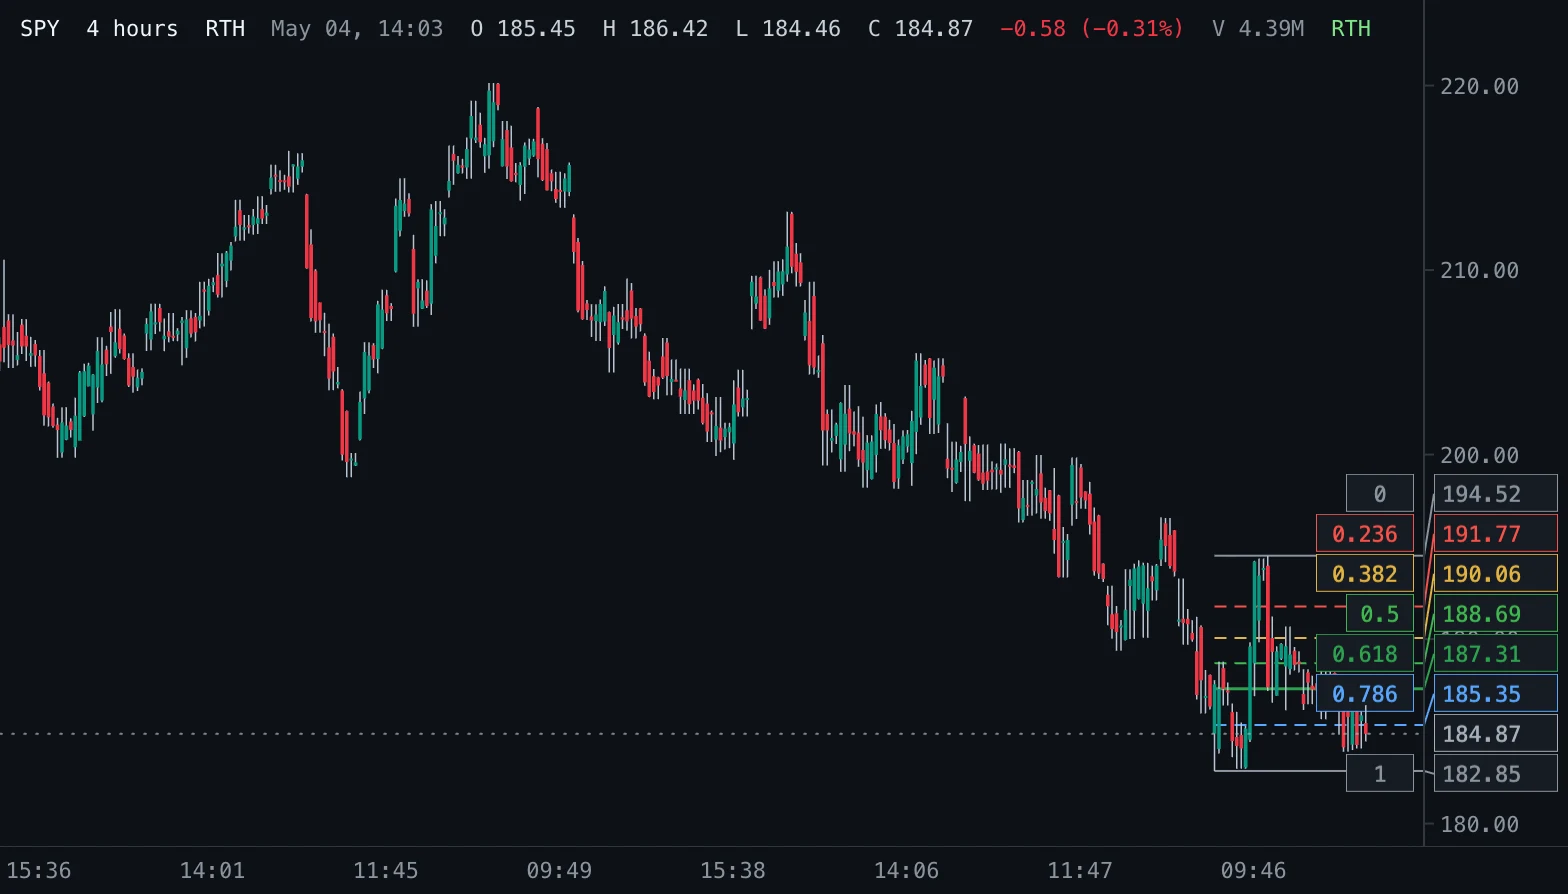
Overview
Auto Fib Retracement finds the latest swing on the chart and draws the Fibonacci retracement levels of it, so you do not have to place the drawing by hand. The swings are found with the Zig Zag swing rule: highs and lows that stand out against the bars around them, alternating, with a minimum move between them. That minimum is the deviation times the 10-bar average true range as a percent of price, so it adapts to the bar size and the market's volatility. The latest swing runs from the second-to-last swing point (its start, level 1) to the last one (its end, level 0).
The levels sit at 0, 23.6, 38.2, 50, 61.8, 78.6 and 100 percent of the swing, measured back from its end, and start at the bar where the swing began. Extensions add 127.2, 161.8 and 261.8 percent of the swing measured from its start, beyond its end.
How to read it
After a swing up, the levels are where a pullback may find support: 38.2 percent is a shallow pullback in a strong trend, 50 to 61.8 percent the classic zone, 78.6 percent a deep one, and a move back through level 1 undoes the whole swing. After a swing down they are resistance for a bounce. The extensions are common targets if price leaves the swing beyond its end.
The levels are references for reaction, not signals; they work best where they line up with other levels. The swing end is confirmed only half the depth bars after it printed and moves while price keeps extending in its direction, so the levels redraw until the next swing in the other direction is confirmed.
Settings and limitations
Deviation sets the smallest swing in multiples of the 10-bar average true range; the default of 3 follows TradingView and works on any bar size; a smaller value (the sensitive preset uses 2) measures smaller, more recent swings, a larger one bigger swings. Depth sets how many bars a swing must stand out against, as in Zig Zag; a larger depth picks bigger, slower swings. Extensions switches the three extension levels.
Nothing is drawn until the chart holds two confirmed swing points. Swings are confirmed when a bar closes, so the levels never change while a bar is forming.
Notes
Swings follow TradingView's Auto Fib Retracement: the Zig Zag swing rule with a deviation of a multiple of the 10-bar average true range as a percent of the close, read at the bar that confirms the swing. TradingView places its 1.618 and higher levels beyond the swing start; this indicator places the extensions beyond the swing end, where traders look for targets. Zig Zag uses a fixed percent instead, so the two can pick different swings.
Settings
Each setting appears in the indicator's settings panel in Spectral, next to a color setting for every output.
| Setting | Type | Default | Range or options | What it does |
|---|---|---|---|---|
| Deviation (x ATR) | Number | 3 | 0 – 50, step 0.1 | The smallest move that counts as a new swing, in multiples of the 10-bar average true range (as a percent of price), as in TradingView's Auto Fib. |
| Depth | Whole number | 10 | 2 – 100 | Bars a swing high or low must stand out against: half of them, but at least 2, on each side, as in Zig Zag. |
| Extensions | On / off | Off | — | Also draw the 127.2, 161.8 and 261.8 percent extensions of the swing, beyond its end. |
Presets
Each preset is its own entry in the Indicators toolbox, with these settings changed.
| Toolbox entry | Short name | Settings |
|---|---|---|
| Auto Fib Retracement (sensitive) | Auto Fib 2x | Deviation (x ATR): 2 |
| Auto Fib Retracement (with extensions) | Auto Fib ext | Extensions: true |
What it draws
Levels
- 0solid · 1 px · value on the axis
#8B949E - 0.236solid · 1 px · value on the axis
#F85149 - 0.382solid · 1 px · value on the axis
#E3B341 - 0.5solid · 1 px · value on the axis
#3FB950 - 0.618solid · 1.5 px · value on the axis
#2DA44E - 0.786solid · 1 px · value on the axis
#58A6FF - 1solid · 1 px · value on the axis
#8B949E - 1.272 extdashed · 1 px · value on the axis
#BC8CFF - 1.618 extdashed · 1 px · value on the axis
#BC8CFF - 2.618 extdotted · 1 px · value on the axis
#BC8CFF
Source
Save it as auto-fib-retracement.js and add it with Indicators → Custom indicators → Add file…. The format is explained in the custom indicators guide.
// Copyright (c) 2026 Spectral
// SPDX-License-Identifier: MIT-0
// Free to use, copy, modify and share: https://spectral.trade/docs/custom-indicators/LICENSE.txt
/** @type {import('./spectral-indicator').IndicatorV2} */
export default {
  schemaVersion: 2,
  id: 'auto-fib-retracement',
  name: 'Auto Fib Retracement',
  shortName: 'Auto Fib',
  version: '1.0.0',
  author: 'Spectral',
  description: 'Fibonacci retracement levels of the latest confirmed swing, with a swing size that scales with volatility, and optional extensions beyond the swing.',
  pane: 'price',
  live: 'none',
  inputs: {
    deviation: { type: 'number', label: 'Deviation (x ATR)', default: 3, min: 0, max: 50, step: 0.1, description: 'The smallest move that counts as a new swing, in multiples of the 10-bar average true range (as a percent of price), as in TradingView\'s Auto Fib.' },
    depth: { type: 'integer', label: 'Depth', default: 10, min: 2, max: 100, description: 'Bars a swing high or low must stand out against: half of them, but at least 2, on each side, as in Zig Zag.' },
    showExtensions: { type: 'boolean', label: 'Extensions', default: false, description: 'Also draw the 127.2, 161.8 and 261.8 percent extensions of the swing, beyond its end.' },
  },
  levels: {
    level0: { label: '0', color: '#8B949E', lineStyle: 'solid', showValue: true },
    level236: { label: '0.236', color: '#F85149', showValue: true },
    level382: { label: '0.382', color: '#E3B341', showValue: true },
    level500: { label: '0.5', color: '#3FB950', showValue: true },
    level618: { label: '0.618', color: '#2DA44E', lineWidth: 1.5, lineStyle: 'solid', showValue: true },
    level786: { label: '0.786', color: '#58A6FF', showValue: true },
    level1: { label: '1', color: '#8B949E', lineStyle: 'solid', showValue: true },
    ext1272: { label: '1.272 ext', color: '#BC8CFF', lineStyle: 'dashed', showValue: true },
    ext1618: { label: '1.618 ext', color: '#BC8CFF', lineStyle: 'dashed', showValue: true },
    ext2618: { label: '2.618 ext', color: '#BC8CFF', lineStyle: 'dotted', showValue: true },
  },
  presets: [
    { id: 'sensitive', name: 'Auto Fib Retracement (sensitive)', shortName: 'Auto Fib 2x', inputs: { deviation: 2 } },
    { id: 'extensions', name: 'Auto Fib Retracement (with extensions)', shortName: 'Auto Fib ext', inputs: { showExtensions: true } },
  ],
  docs: {
    overview: 'Auto Fib Retracement finds the latest swing on the chart and draws the Fibonacci retracement levels of it, so you do not have to place the drawing by hand. The swings are found with the Zig Zag swing rule: highs and lows that stand out against the bars around them, alternating, with a minimum move between them. That minimum is the deviation times the 10-bar average true range as a percent of price, so it adapts to the bar size and the market\'s volatility. The latest swing runs from the second-to-last swing point (its start, level 1) to the last one (its end, level 0).\n\nThe levels sit at 0, 23.6, 38.2, 50, 61.8, 78.6 and 100 percent of the swing, measured back from its end, and start at the bar where the swing began. Extensions add 127.2, 161.8 and 261.8 percent of the swing measured from its start, beyond its end.',
    howToRead: 'After a swing up, the levels are where a pullback may find support: 38.2 percent is a shallow pullback in a strong trend, 50 to 61.8 percent the classic zone, 78.6 percent a deep one, and a move back through level 1 undoes the whole swing. After a swing down they are resistance for a bounce. The extensions are common targets if price leaves the swing beyond its end.\n\nThe levels are references for reaction, not signals; they work best where they line up with other levels. The swing end is confirmed only half the depth bars after it printed and moves while price keeps extending in its direction, so the levels redraw until the next swing in the other direction is confirmed.',
    settings: 'Deviation sets the smallest swing in multiples of the 10-bar average true range; the default of 3 follows TradingView and works on any bar size; a smaller value (the sensitive preset uses 2) measures smaller, more recent swings, a larger one bigger swings. Depth sets how many bars a swing must stand out against, as in Zig Zag; a larger depth picks bigger, slower swings. Extensions switches the three extension levels.\n\nNothing is drawn until the chart holds two confirmed swing points. Swings are confirmed when a bar closes, so the levels never change while a bar is forming.',
    notes: 'Swings follow TradingView\'s Auto Fib Retracement: the Zig Zag swing rule with a deviation of a multiple of the 10-bar average true range as a percent of the close, read at the bar that confirms the swing. TradingView places its 1.618 and higher levels beyond the swing start; this indicator places the extensions beyond the swing end, where traders look for targets. Zig Zag uses a fixed percent instead, so the two can pick different swings.',
  },
  calculate(ctx) {
    const { bars, inputs } = ctx;
    const levels = {
      level0: null, level236: null, level382: null, level500: null, level618: null, level786: null, level1: null,
      ext1272: null, ext1618: null, ext2618: null,
    };
    // The turn threshold in percent: deviation x ATR(10) / close, read at the bar that confirms the swing.
    const atr = ctx.ta.atr(bars, 10);
    const thresholdAt = (index) => (atr[index] === null ? Infinity : inputs.deviation * atr[index] / bars[index].close * 100);
    const pivots = zigZagPivots(bars, inputs.depth, thresholdAt);
    if (pivots.length < 2) return { levels };
    const start = pivots[pivots.length - 2];
    const end = pivots[pivots.length - 1];
    const swing = end.price - start.price;
    const at = (price) => ({ price, fromIndex: start.index });
    const retracement = (ratio) => at(end.price - swing * ratio);
    levels.level0 = retracement(0);
    levels.level236 = retracement(0.236);
    levels.level382 = retracement(0.382);
    levels.level500 = retracement(0.5);
    levels.level618 = retracement(0.618);
    levels.level786 = retracement(0.786);
    levels.level1 = retracement(1);
    if (inputs.showExtensions) {
      levels.ext1272 = at(start.price + swing * 1.272);
      levels.ext1618 = at(start.price + swing * 1.618);
      levels.ext2618 = at(start.price + swing * 2.618);
    }
    return { levels };
  },
};

/**
 * Confirmed Zig Zag swings, oldest first: `{ index, price, isHigh }`. A swing high's high beats the
 * `depth / 2` (at least 2) older highs strictly and is not exceeded by as many newer ones (mirrored for
 * lows); swings alternate, a turn needs a move of `thresholdAt(confirming bar)` percent from the last
 * swing in its own direction, and a more extreme swing in the same direction replaces the last one: the
 * Zig Zag indicator's rule, with its fixed percent replaced by a threshold per bar.
 */
function zigZagPivots(bars, depth, thresholdAt) {
  const half = Math.max(2, Math.floor(depth / 2));
  const pivots = [];
  const standsOut = (index, isHigh) => {
    const value = isHigh ? bars[index].high : bars[index].low;
    for (let step = 1; step <= half; step += 1) {
      const older = isHigh ? bars[index - step].high : bars[index - step].low;
      const newer = isHigh ? bars[index + step].high : bars[index + step].low;
      if (isHigh ? older >= value || newer > value : older <= value || newer < value) return false;
    }
    return true;
  };
  const consider = (index, isHigh) => {
    const price = isHigh ? bars[index].high : bars[index].low;
    const last = pivots[pivots.length - 1];
    if (!last) {
      pivots.push({ index, price, isHigh });
    } else if (last.isHigh === isHigh) {
      if (isHigh ? price > last.price : price < last.price) {
        last.index = index;
        last.price = price;
      }
    } else if (index !== last.index && (isHigh ? price - last.price : last.price - price) / Math.abs(last.price) * 100 >= thresholdAt(index + half)) {
      pivots.push({ index, price, isHigh });
    }
  };
  for (let index = half; index + half < bars.length; index += 1) {
    const high = standsOut(index, true);
    const low = standsOut(index, false);
    if (high && low) {
      // Try the turn first: after a swing high the low, otherwise the high.
      const lastIsHigh = pivots.length > 0 && pivots[pivots.length - 1].isHigh;
      consider(index, !lastIsHigh);
      consider(index, lastIsHigh);
    } else if (high) {
      consider(index, true);
    } else if (low) {
      consider(index, false);
    }
  }
  return pivots;
}
Adapt it with an LLM
Paste this into your assistant and replace the second-to-last line with the change you want.
Start from this Spectral custom indicator: https://spectral.trade/indicators/auto-fib-retracement.js
Format reference: https://spectral.trade/docs/custom-indicators.llm.md
Keep the file format and every rule of the reference; give the result a new id, name, shortName and version, and update docs and input descriptions to match.
Keep its live updates exact and fast (section "Fast live updates" of the reference): carry values from bar to bar only through ctx.ta, and raise live.lookback if the change reads further back; Spectral rejects a file whose live updates differ from a full recalculation or are too slow.
Change I want: <describe the change>
Answer with the complete file in one code block, ready to save as <id>.js.
Related indicators
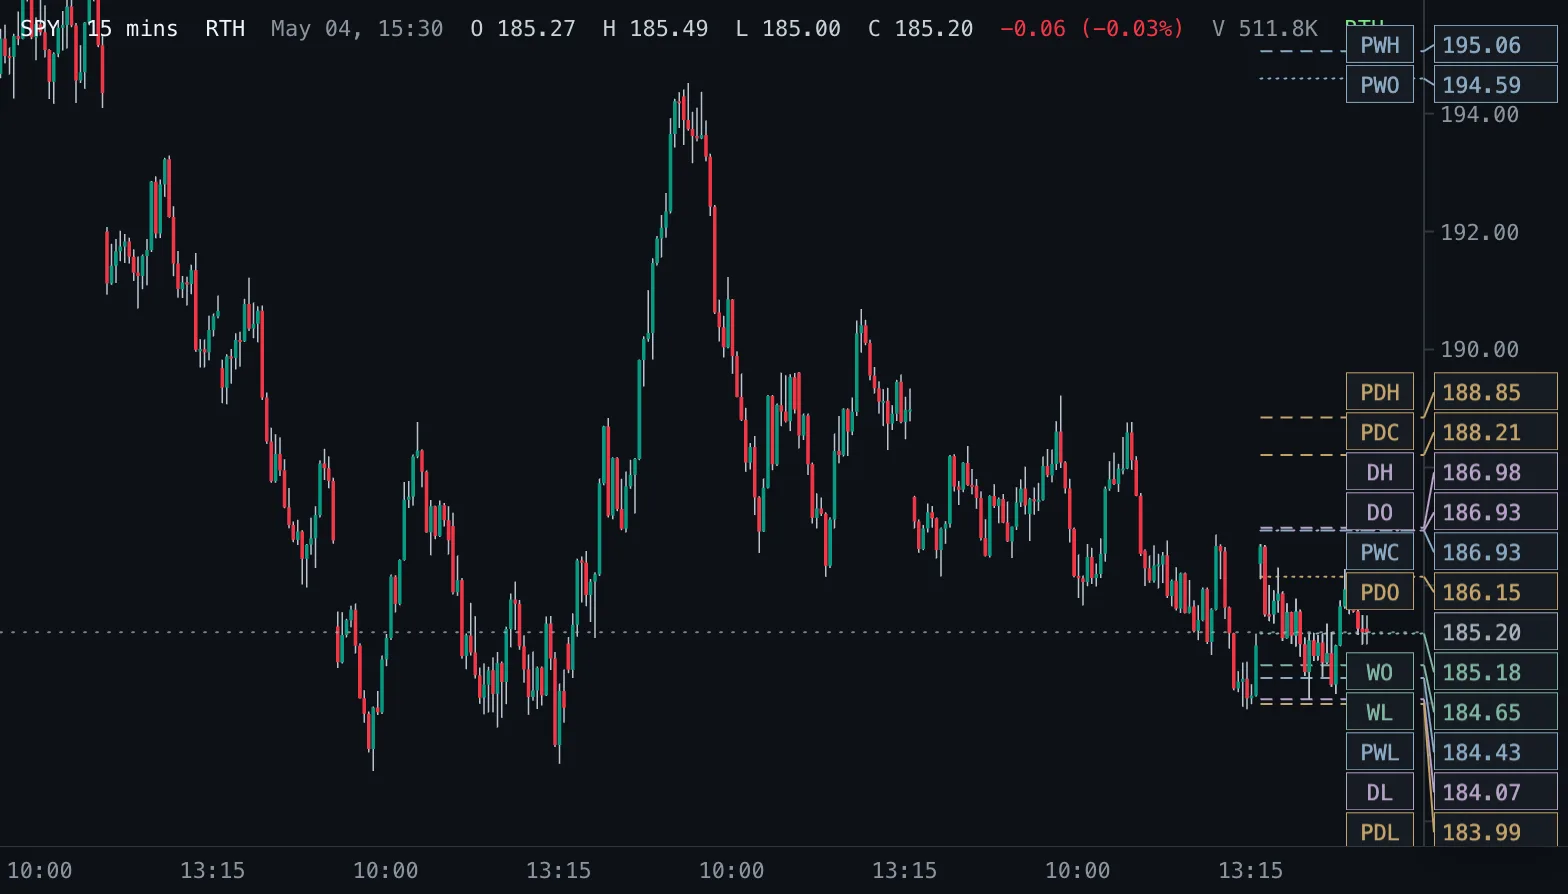
Daily & Weekly Levels D/W Levels
Previous and current day and week open, high, low and close as levels, read from real daily and weekly bars.
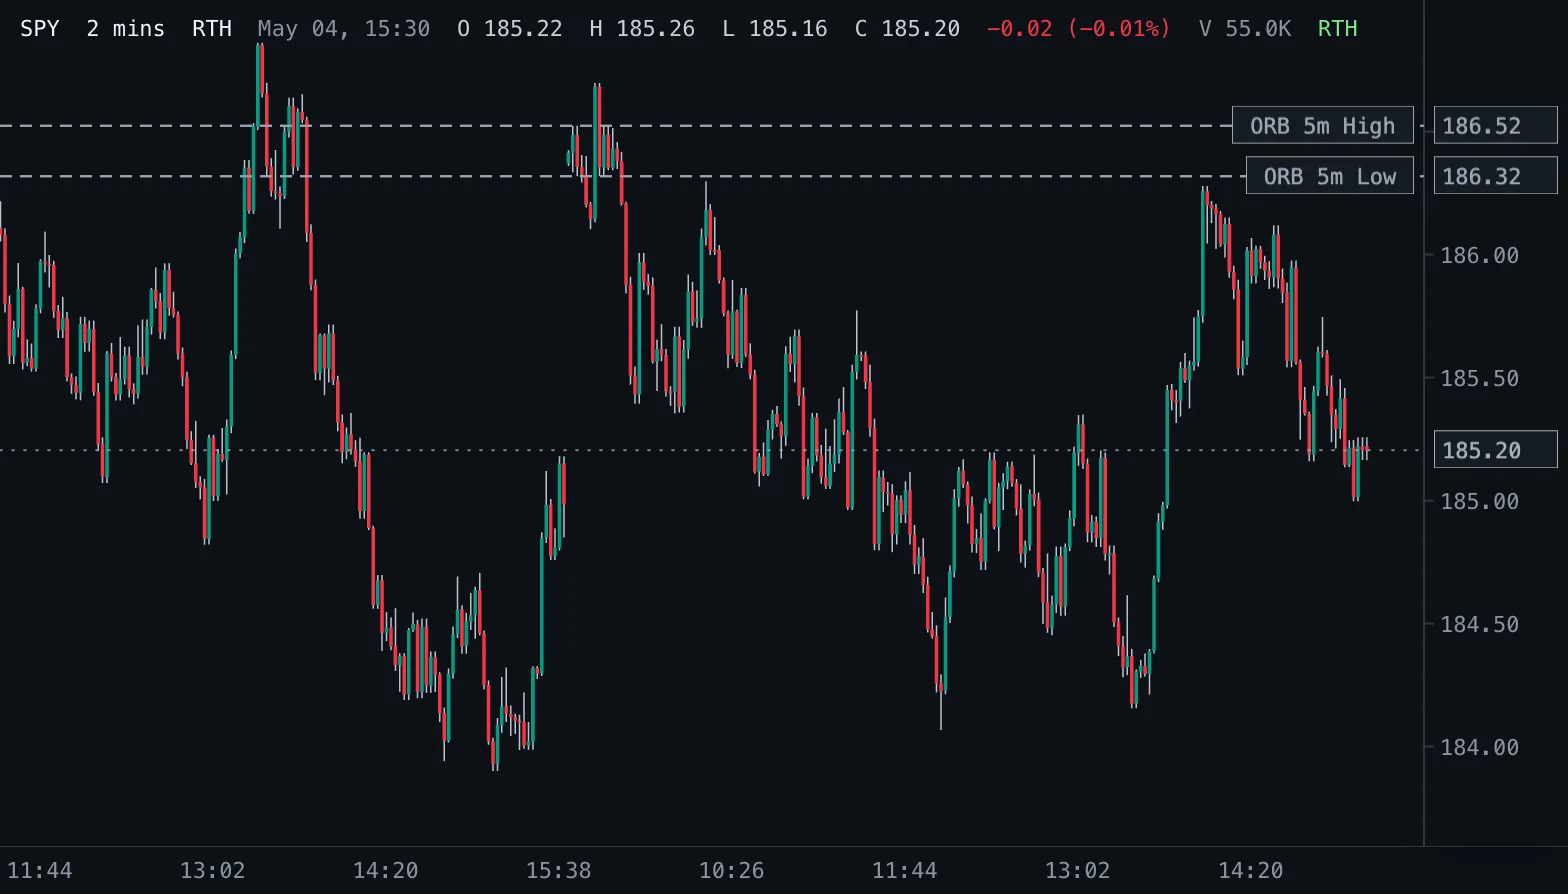
Opening Range Breakout ORB
Opening-range highs and lows for 1, 2, 5, 10, 15, 30 and 60 minutes after the 09:30 New York open.
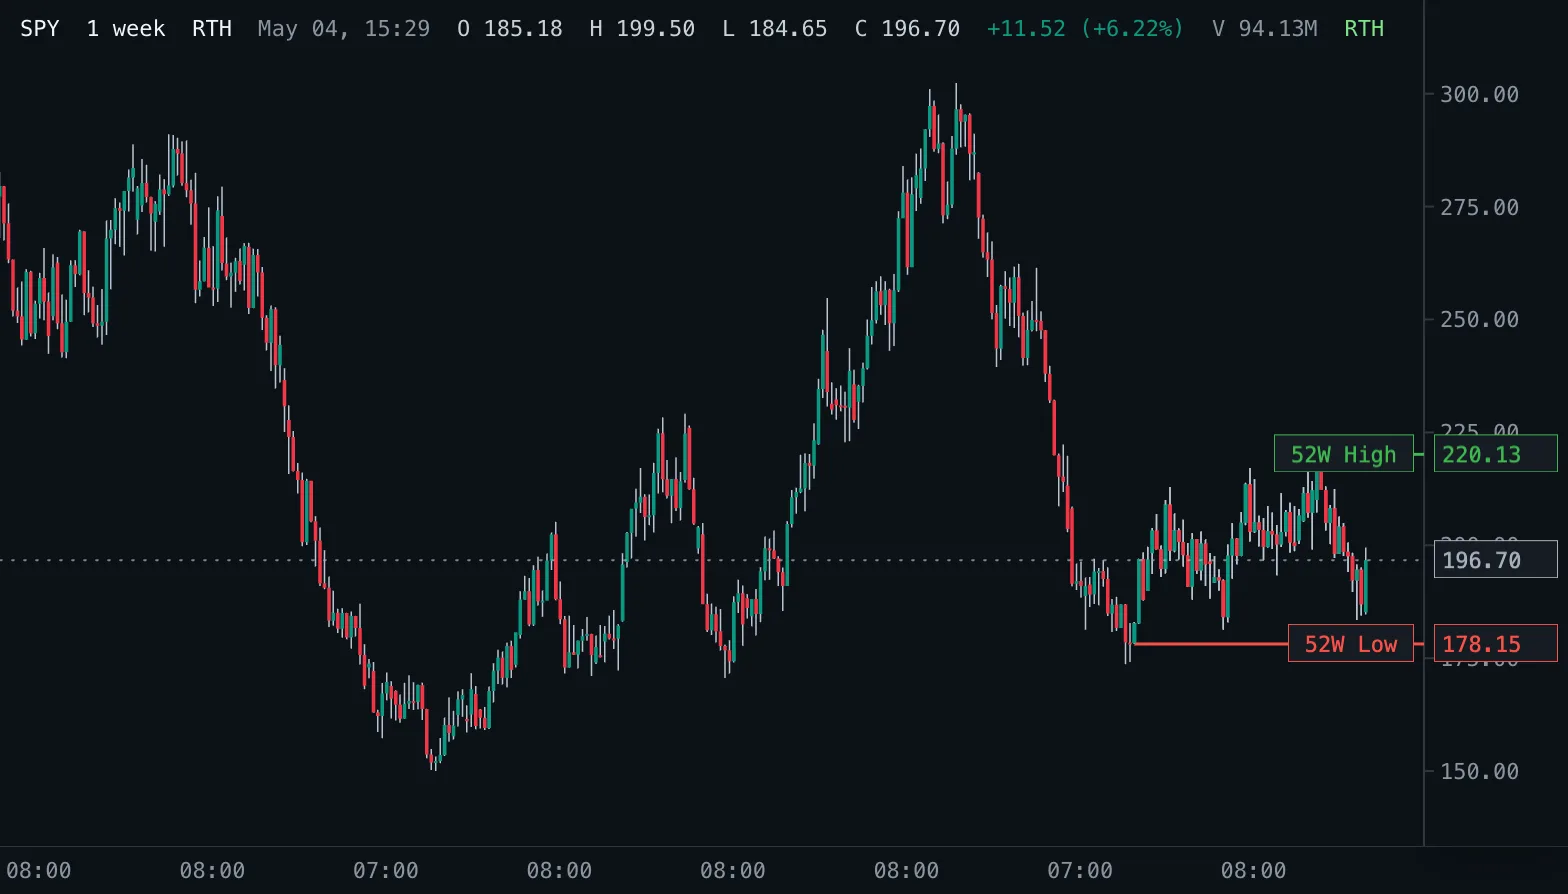
52-Week High/Low 52W H/L
The highest high and lowest low of the last 52 weeks as levels, read from real daily bars.