Current Week High/Low
Developing high and low of the current trading week as horizontal levels, with optional history.
- CWx
- Built into Spectral
- Updates every tick
- current week
- weekly high
- weekly low
- range
MIT-0: free to use, change and share, no attribution needed. What you build from it is yours.
Already in Spectral: add it from the Indicators toolbox. The file here is the same indicator written as a custom indicator, to change or learn from. Installed, it appears next to the built-in one, marked Custom.
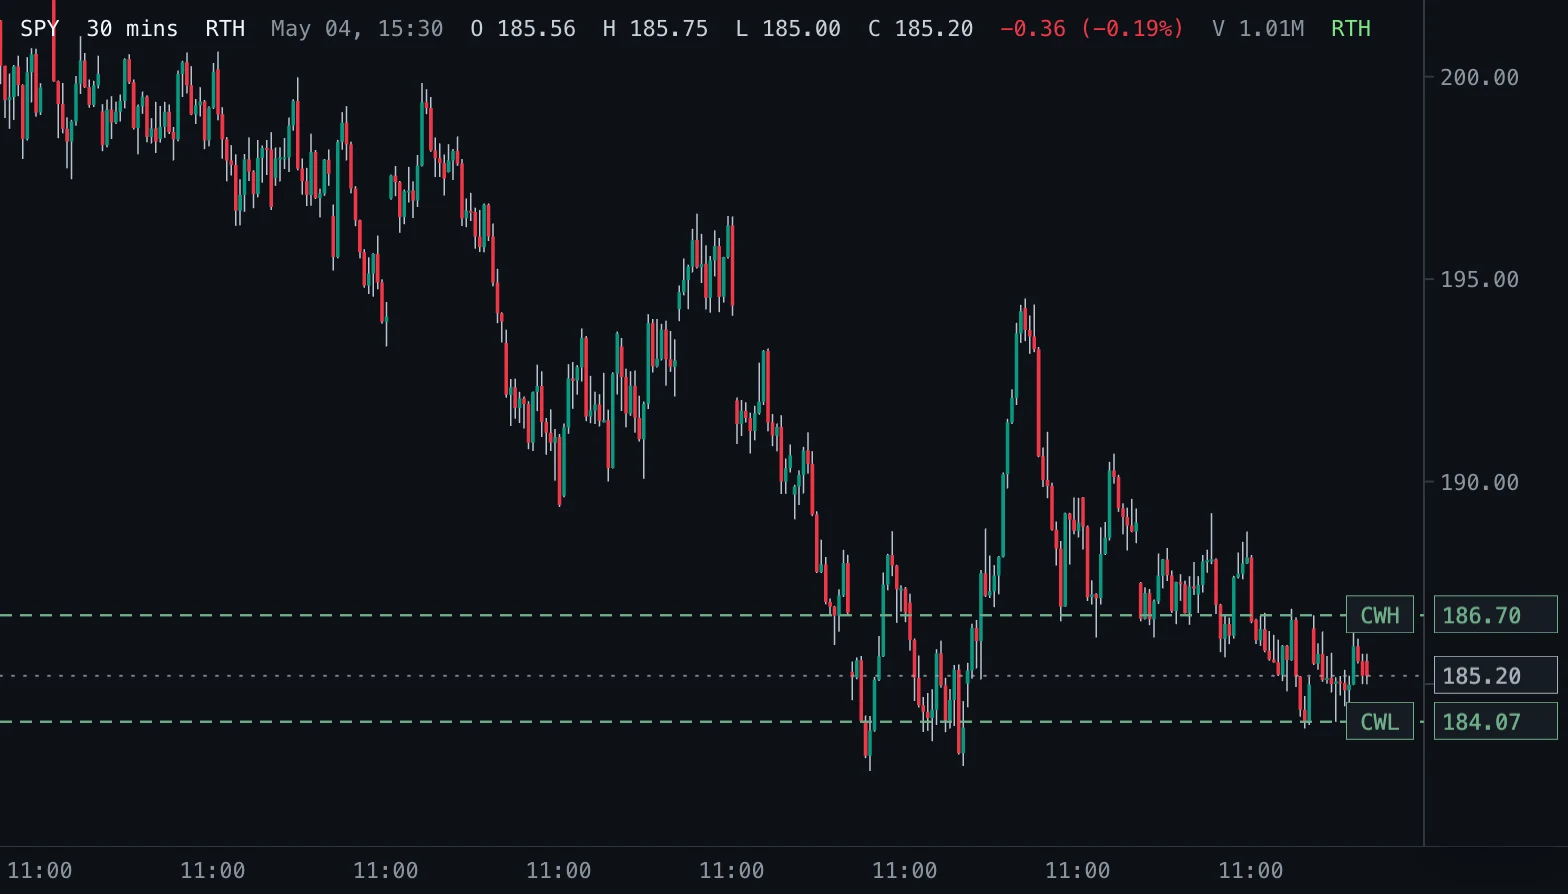
Overview
Current Week High/Low tracks the highest high and the lowest low of the developing calendar trading week (New York time) and draws them as two horizontal levels that move as new extremes print.
How to read it
The levels show the range the market has traded so far this week. Tests of the week's high or low show whether the range is expanding; repeated rejections at one side often mark it as the week's reference.
Settings and limitations
Show history adds step lines that show how every week's high and low developed bar by bar. Pre-market and after-hours bars count when the chart shows them.
Notes
Computes the same levels as the built-in CWx in Spectral. The levels change while the week develops, so they are context, not fixed support or resistance.
Settings
Each setting appears in the indicator's settings panel in Spectral, next to a color setting for every output.
| Setting | Type | Default | Range or options | What it does |
|---|---|---|---|---|
| Show history | On / off | Off | — | Also draw how each week's high and low developed bar by bar, as step lines. |
What it draws
Lines
- CWH historydotted · 1 px · primary
#6FAF8A - CWL historydotted · 1 px
#6FAF8A
Levels
- CWHsolid · 1 px · value on the axis
#6FAF8A - CWLsolid · 1 px · value on the axis
#6FAF8A
Source
Save it as cwx.js and add it with Indicators → Custom indicators → Add file…. The format is explained in the custom indicators guide.
// Copyright (c) 2026 Spectral
// SPDX-License-Identifier: MIT-0
// Free to use, copy, modify and share: https://spectral.trade/docs/custom-indicators/LICENSE.txt
/** @type {import('./spectral-indicator').IndicatorV1} */
export default {
  schemaVersion: 1,
  id: 'cwx',
  name: 'Current Week High/Low',
  shortName: 'CWx',
  version: '1.0.0',
  author: 'Spectral',
  description: 'Developing high and low of the current trading week as horizontal levels, with optional history.',
  pane: 'price',
  live: { lookback: 0 },
  inputs: {
    showHistory: { type: 'boolean', label: 'Show history', default: false, description: 'Also draw how each week\'s high and low developed bar by bar, as step lines.' },
  },
  levels: {
    high: { label: 'CWH', color: '#6FAF8A', showValue: true },
    low: { label: 'CWL', color: '#6FAF8A', showValue: true },
  },
  plots: {
    highHistory: { label: 'CWH history', color: '#6FAF8A', lineStyle: 'dotted', primary: true },
    lowHistory: { label: 'CWL history', color: '#6FAF8A', lineStyle: 'dotted' },
  },
  docs: {
    overview: 'Current Week High/Low tracks the highest high and the lowest low of the developing calendar trading week (New York time) and draws them as two horizontal levels that move as new extremes print.',
    howToRead: 'The levels show the range the market has traded so far this week. Tests of the week\'s high or low show whether the range is expanding; repeated rejections at one side often mark it as the week\'s reference.',
    settings: 'Show history adds step lines that show how every week\'s high and low developed bar by bar. Pre-market and after-hours bars count when the chart shows them.',
    notes: 'Computes the same levels as the built-in CWx in Spectral. The levels change while the week develops, so they are context, not fixed support or resistance.',
  },
  calculate(ctx) {
    const { bars, inputs, ta, time } = ctx;
    // The week's high and low carry from bar to bar through ta.scan; a new New York week starts them again.
    // A bar that changes nothing returns the state itself, which ta.scan keeps without copying it.
    const states = ta.scan(bars, { week: '', high: null, low: null }, (state, bar) => {
      const week = time.ny(bar).weekKey;
      if (week !== state.week) return { week, high: bar.high, low: bar.low };
      if (bar.high <= state.high && bar.low >= state.low) return state;
      return { week, high: Math.max(state.high, bar.high), low: Math.min(state.low, bar.low) };
    });
    const last = states.length > 0 ? states[states.length - 1] : { high: null, low: null };
    const highHistory = states.map((state) => (inputs.showHistory ? state.high : null));
    const lowHistory = states.map((state) => (inputs.showHistory ? state.low : null));
    return { levels: { high: last.high, low: last.low }, plots: { highHistory, lowHistory } };
  },
};
Adapt it with an LLM
Paste this into your assistant and replace the second-to-last line with the change you want.
Start from this Spectral custom indicator: https://spectral.trade/indicators/cwx.js
Format reference: https://spectral.trade/docs/custom-indicators.llm.md
Keep the file format and every rule of the reference; give the result a new id, name, shortName and version, and update docs and input descriptions to match.
Keep its live updates exact and fast (section "Fast live updates" of the reference): carry values from bar to bar only through ctx.ta, and raise live.lookback if the change reads further back; Spectral rejects a file whose live updates differ from a full recalculation or are too slow.
Change I want: <describe the change>
Answer with the complete file in one code block, ready to save as <id>.js.
Related indicators
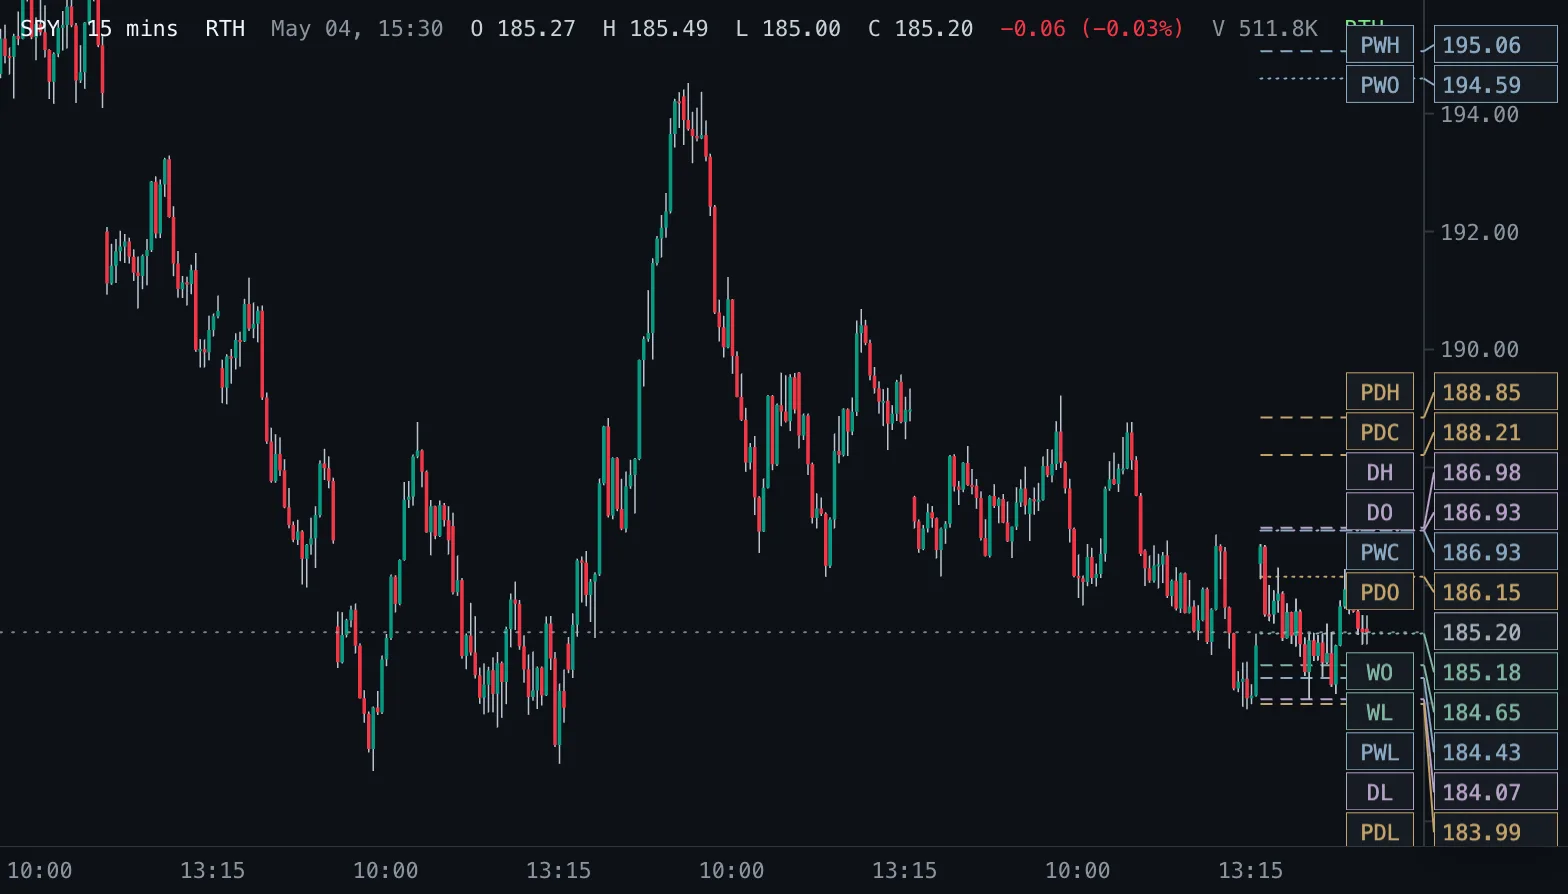
Daily & Weekly Levels D/W Levels
Previous and current day and week open, high, low and close as levels, read from real daily and weekly bars.
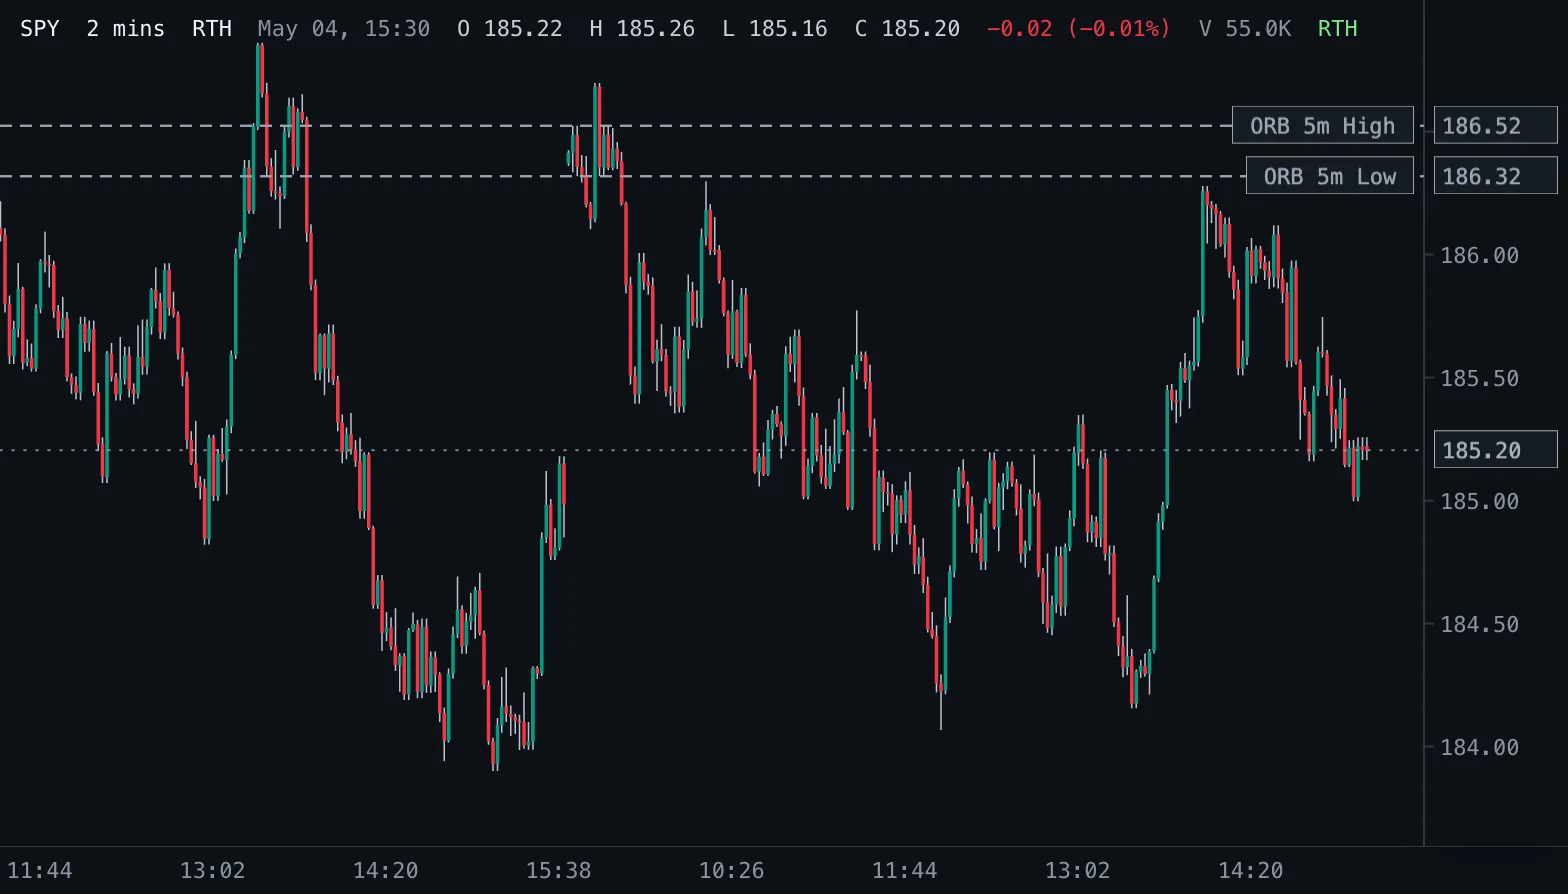
Opening Range Breakout ORB
Opening-range highs and lows for 1, 2, 5, 10, 15, 30 and 60 minutes after the 09:30 New York open.
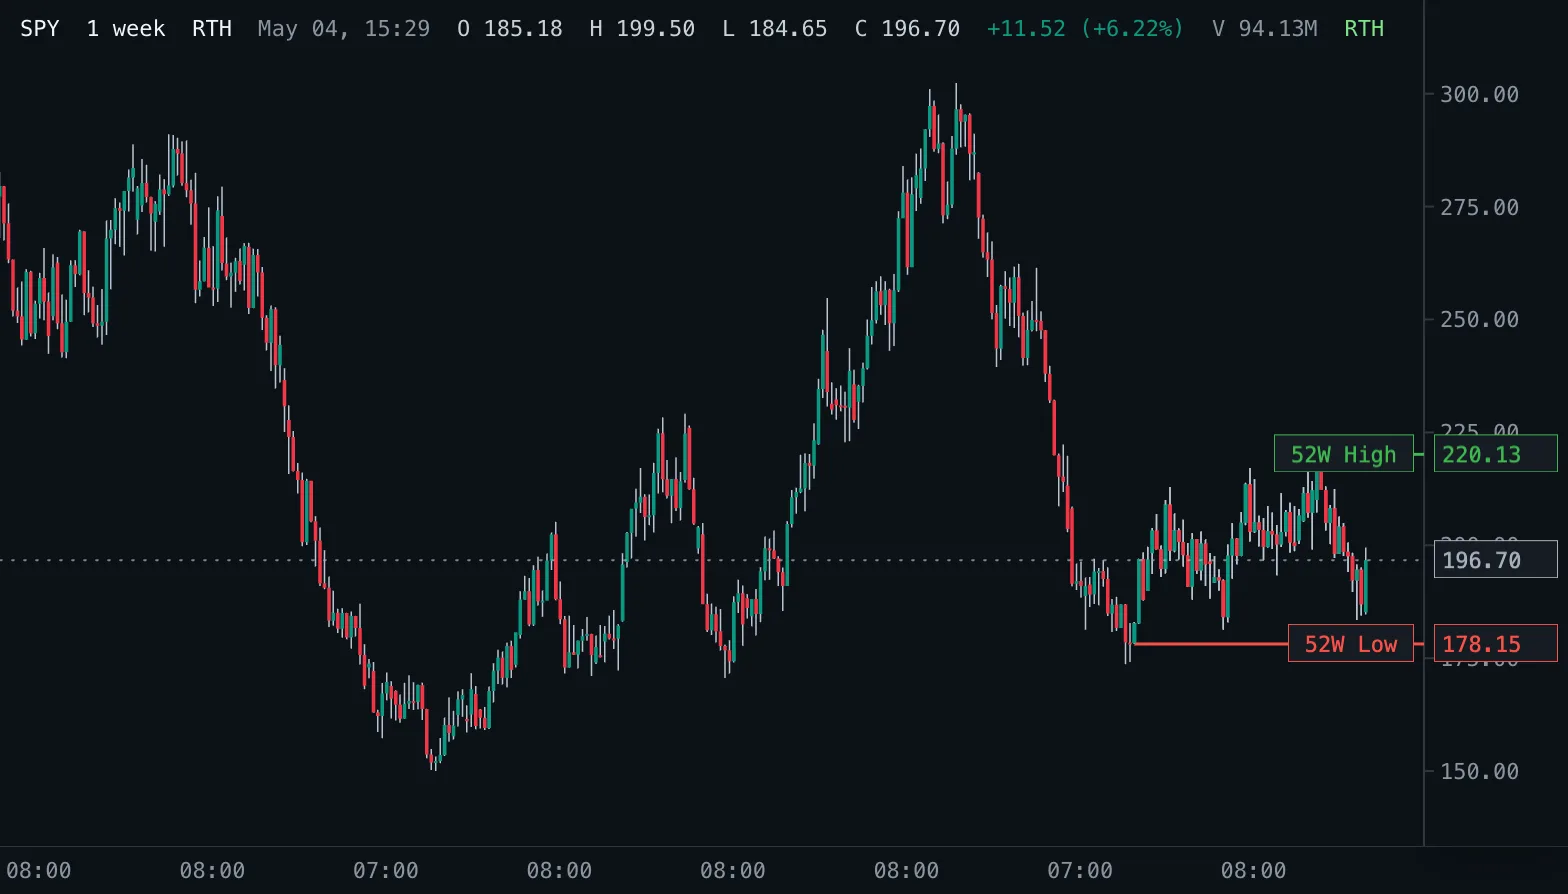
52-Week High/Low 52W H/L
The highest high and lowest low of the last 52 weeks as levels, read from real daily bars.