Fair Value Gaps
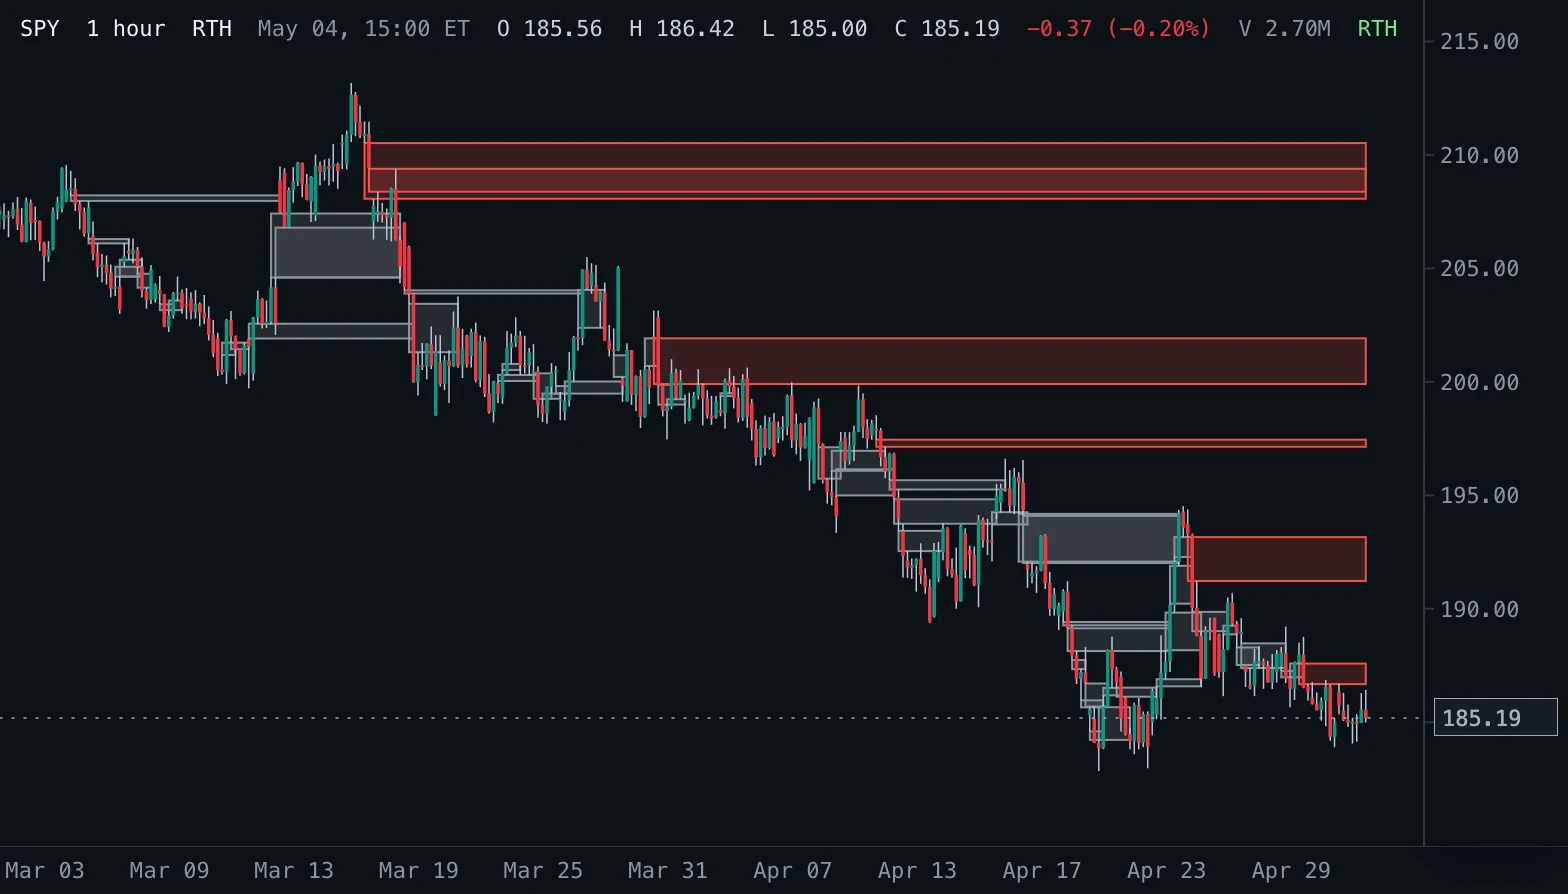
Boxes every three-bar fair value gap from its first bar until price fills (or touches) it, labelled with the gap size; hovering a box shows its size in percent and whether it is still open.
- FVG
- Updates at bar close
- fair value gap
- fvg
- ict
- imbalance
- gap
- box
MIT-0: free to use, change and share, no attribution needed. What you build from it is yours.
Overview
A fair value gap (FVG, from ICT's inner-circle-trader teaching) is a three-bar pattern where the middle bar moved so fast that the outer bars do not overlap: bullish when the third bar's low is above the first bar's high, bearish when the third bar's high is below the first bar's low. The gap between them is boxed from the first of the three bars until price mitigates it.
How to read it
Open gaps (green bullish, red bearish) reach the latest bar; a mitigated gap is drawn grey and ends on the bar that mitigated it. Open gaps often act as support (bullish) or resistance (bearish) when price returns to them. Hover a box for its direction, size, share of the price and state.
Settings and limitations
Minimum gap % hides small gaps; Gaps shown limits the drawn boxes to the most recent ones. Mitigated when chooses the rule that closes a gap: Filled (price trades through to the gap's far side, the default) or Touched (price trades back into it). The three colours and the box opacity are appearance settings.
Notes
Rule: bullish FVG when low[i] > high[i - 2], the gap spanning high[i - 2] to low[i]; bearish when high[i] < low[i - 2], spanning high[i] to low[i - 2] (the common ICT definition; there is no formal standard for mitigation, so both readings are offered: a later low at or below the bottom of a bullish gap fills it, one at or below its top touches it; mirrored for bearish gaps). The bar that completes a gap never mitigates it. Minimum gap % compares the gap with the close that formed it. Marks completed bars only (live: none). The text is the gap size in price; the tooltip adds the size as a percentage of that close and whether the gap is open.
Settings
Each setting appears in the indicator's settings panel in Spectral, next to a color setting for every output.
| Setting | Type | Default | Range or options | What it does |
|---|---|---|---|---|
| Minimum gap % | Number | 0.05 | 0 – 5, step 0.01 | Smallest gap drawn, as a percentage of the price. |
| Gaps shown | Whole number | 60 | 1 – 500 | Most recent gaps drawn (open and filled). |
| Mitigated when | Choice | Filled | Filled, Touched | Filled: a later bar trades through the gap to its far side. Touched: a later bar trades back into the gap at all. |
What it draws
Boxes
- Fair value gapsfilled at 18% opacity · colors from Gap (3 colors)
#3FB950 #F85149 #8B949E
Source
Save it as fair-value-gaps.js and add it with Indicators → Custom indicators → Add file…. The format is explained in the custom indicators guide.
// Copyright (c) 2026 Spectral
// SPDX-License-Identifier: MIT-0
// Free to use, copy, modify and share: https://spectral.trade/docs/custom-indicators/LICENSE.txt
/** @type {import('./spectral-indicator').IndicatorV3} */
export default {
  schemaVersion: 3,
  id: 'fair-value-gaps',
  name: 'Fair Value Gaps',
  shortName: 'FVG',
  version: '1.0.0',
  author: 'Spectral examples',
  description: 'Boxes every three-bar fair value gap from its first bar until price fills (or touches) it, labelled with the gap size; hovering a box shows its size in percent and whether it is still open.',
  pane: 'price',
  live: 'none',
  inputs: {
    minGap: { type: 'number', label: 'Minimum gap %', default: 0.05, min: 0, max: 5, step: 0.01, description: 'Smallest gap drawn, as a percentage of the price.' },
    maxBoxes: { type: 'integer', label: 'Gaps shown', default: 60, min: 1, max: 500, description: 'Most recent gaps drawn (open and filled).' },
    mitigation: { type: 'select', label: 'Mitigated when', default: 'Filled', options: ['Filled', 'Touched'], description: 'Filled: a later bar trades through the gap to its far side. Touched: a later bar trades back into the gap at all.' },
  },
  palettes: {
    gap: { label: 'Gap', colors: ['#3FB950', '#F85149', '#8B949E'] },
  },
  boxes: {
    gaps: { label: 'Fair value gaps', color: '#3FB950', palette: 'gap', opacity: 0.18, textSize: 'small', hideBelowBarWidth: 3 },
  },
  docs: {
    overview: 'A fair value gap (FVG, from ICT\'s inner-circle-trader teaching) is a three-bar pattern where the middle bar moved so fast that the outer bars do not overlap: bullish when the third bar\'s low is above the first bar\'s high, bearish when the third bar\'s high is below the first bar\'s low. The gap between them is boxed from the first of the three bars until price mitigates it.',
    howToRead: 'Open gaps (green bullish, red bearish) reach the latest bar; a mitigated gap is drawn grey and ends on the bar that mitigated it. Open gaps often act as support (bullish) or resistance (bearish) when price returns to them. Hover a box for its direction, size, share of the price and state.',
    settings: 'Minimum gap % hides small gaps; Gaps shown limits the drawn boxes to the most recent ones. Mitigated when chooses the rule that closes a gap: Filled (price trades through to the gap\'s far side, the default) or Touched (price trades back into it). The three colours and the box opacity are appearance settings.',
    notes: 'Rule: bullish FVG when low[i] > high[i - 2], the gap spanning high[i - 2] to low[i]; bearish when high[i] < low[i - 2], spanning high[i] to low[i - 2] (the common ICT definition; there is no formal standard for mitigation, so both readings are offered: a later low at or below the bottom of a bullish gap fills it, one at or below its top touches it; mirrored for bearish gaps). The bar that completes a gap never mitigates it. Minimum gap % compares the gap with the close that formed it. Marks completed bars only (live: none). The text is the gap size in price; the tooltip adds the size as a percentage of that close and whether the gap is open.',
  },
  calculate(ctx) {
    const { bars, inputs, format } = ctx;
    const gaps = [];
    // The price that mitigates a gap: its far side when it must fill, its near side when a touch is enough.
    const touch = inputs.mitigation === 'Touched';
    const edgeOf = (gap) => (gap.bullish === touch ? gap.top : gap.bottom);
    // Open gaps, ordered so the ones the next bar mitigates sit at the end: bullish by edge (ascending; a later low
    // at or under the edge mitigates it), bearish by edge (descending; a later high at or over the edge mitigates it).
    const openBullish = [];
    const openBearish = [];
    // Where to insert into an ordered list: after every entry `before` accepts (binary search).
    const insertAt = (list, before) => {
      let low = 0;
      let high = list.length;
      while (low < high) {
        const middle = (low + high) >> 1;
        if (before(list[middle])) low = middle + 1;
        else high = middle;
      }
      return low;
    };
    for (let index = 2; index < bars.length; index += 1) {
      const first = bars[index - 2];
      const bar = bars[index];
      // A gap is mitigated once a later bar reaches its edge (see edgeOf).
      while (openBullish.length > 0 && bar.low <= edgeOf(openBullish[openBullish.length - 1])) openBullish.pop().filledAt = index;
      while (openBearish.length > 0 && bar.high >= edgeOf(openBearish[openBearish.length - 1])) openBearish.pop().filledAt = index;
      const bullish = bar.low > first.high;
      const bearish = bar.high < first.low;
      if (!bullish && !bearish) continue;
      const bottom = bullish ? first.high : bar.high;
      const top = bullish ? bar.low : first.low;
      if ((top - bottom) / bar.close * 100 < inputs.minGap) continue;
      const gap = { from: index - 2, bottom, top, bullish, close: bar.close, filledAt: -1 };
      gaps.push(gap);
      const edge = edgeOf(gap);
      if (bullish) openBullish.splice(insertAt(openBullish, (open) => edgeOf(open) < edge), 0, gap);
      else openBearish.splice(insertAt(openBearish, (open) => edgeOf(open) > edge), 0, gap);
    }
    return {
      boxes: {
        gaps: gaps.slice(-inputs.maxBoxes).map((gap) => ({
          x1: gap.from,
          y1: gap.bottom,
          x2: gap.filledAt >= 0 ? gap.filledAt : 'right-edge',
          y2: gap.top,
          palette: gap.filledAt >= 0 ? 2 : gap.bullish ? 0 : 1,
          text: format.price(gap.top - gap.bottom),
          tooltip: `${gap.bullish ? 'Bullish' : 'Bearish'} gap ${format.price(gap.top - gap.bottom)} (${format.percent((gap.top - gap.bottom) / gap.close, 2)})\n${gap.filledAt >= 0 && touch ? 'Touched' : gap.filledAt >= 0 ? 'Filled' : 'Open'}`,
        })),
      },
    };
  },
};
Adapt it with an LLM
Paste this into your assistant and replace the second-to-last line with the change you want.
Start from this Spectral custom indicator: https://spectral.trade/indicators/fair-value-gaps.js
Format reference: https://spectral.trade/docs/custom-indicators.llm.md
Keep the file format and every rule of the reference; give the result a new id, name, shortName and version, and update docs and input descriptions to match.
Keep its live updates exact and fast (section "Fast live updates" of the reference): carry values from bar to bar only through ctx.ta, and raise live.lookback if the change reads further back; Spectral rejects a file whose live updates differ from a full recalculation or are too slow.
Change I want: <describe the change>
Answer with the complete file in one code block, ready to save as <id>.js.
Related indicators
Inside Bar Breakouts IB Break
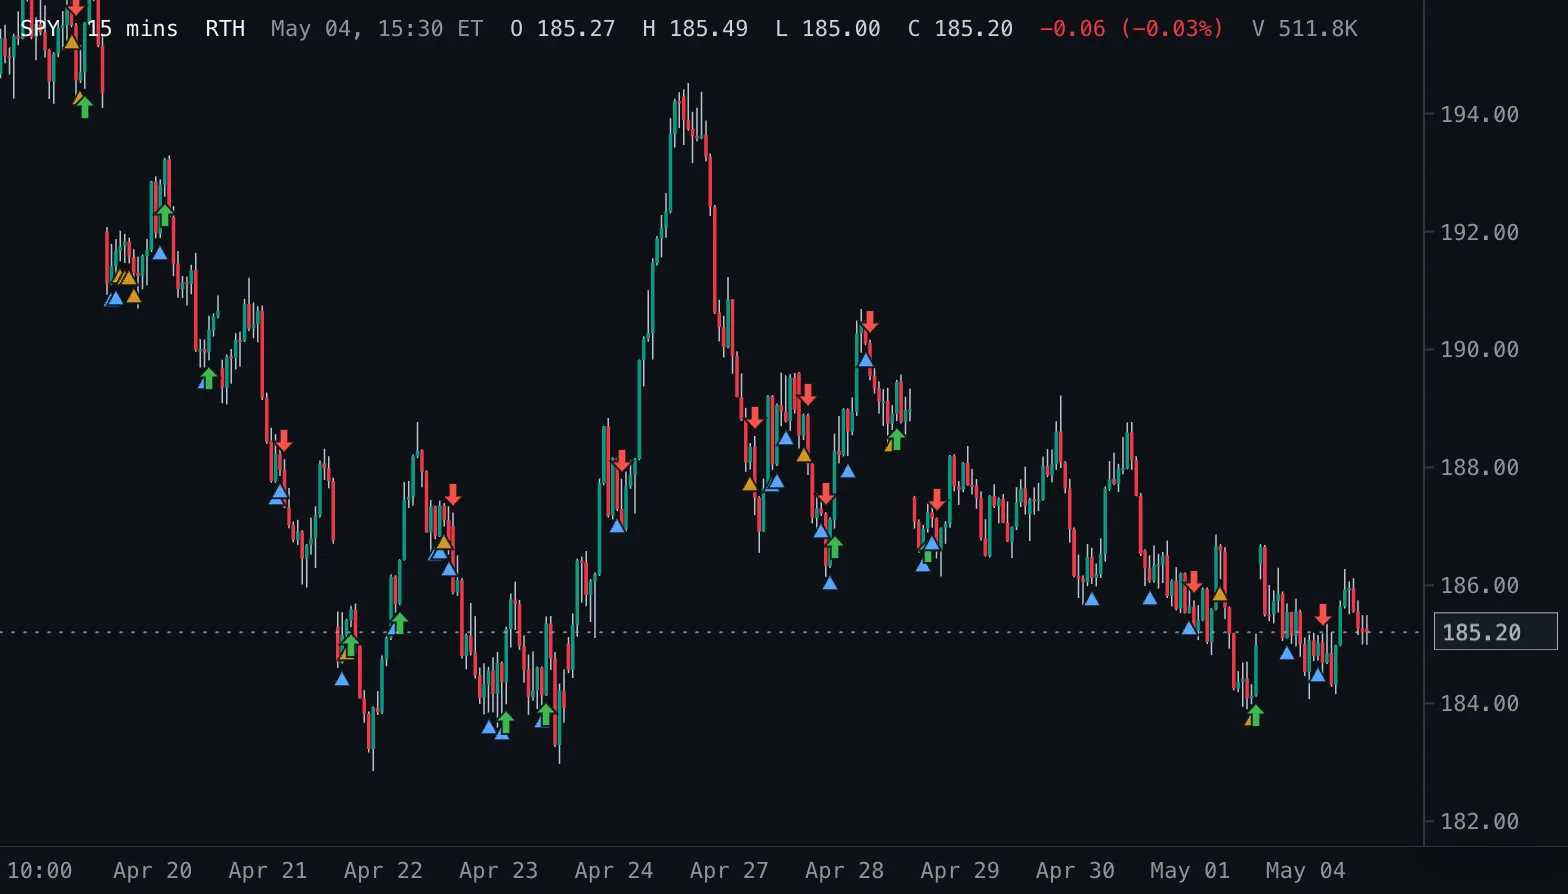
Marks inside bars with a triangle below the bar and the first close beyond the mother bar with an arrow.
Inside Bars IB
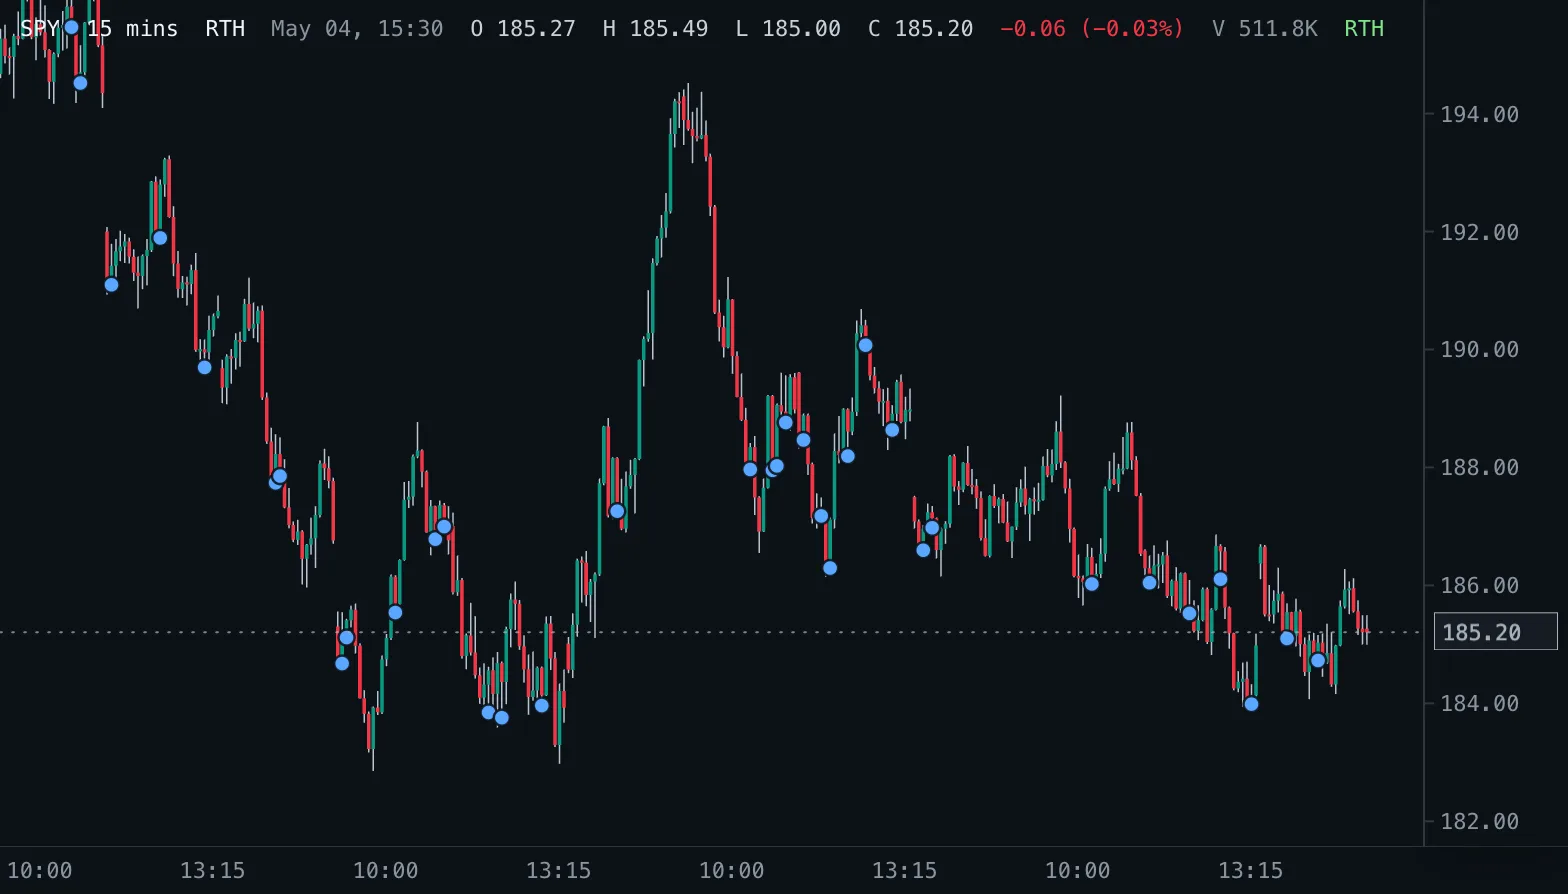
Marks completed bars whose high and low sit inside the previous bar.
Market Structure BOS/CHoCH Structure
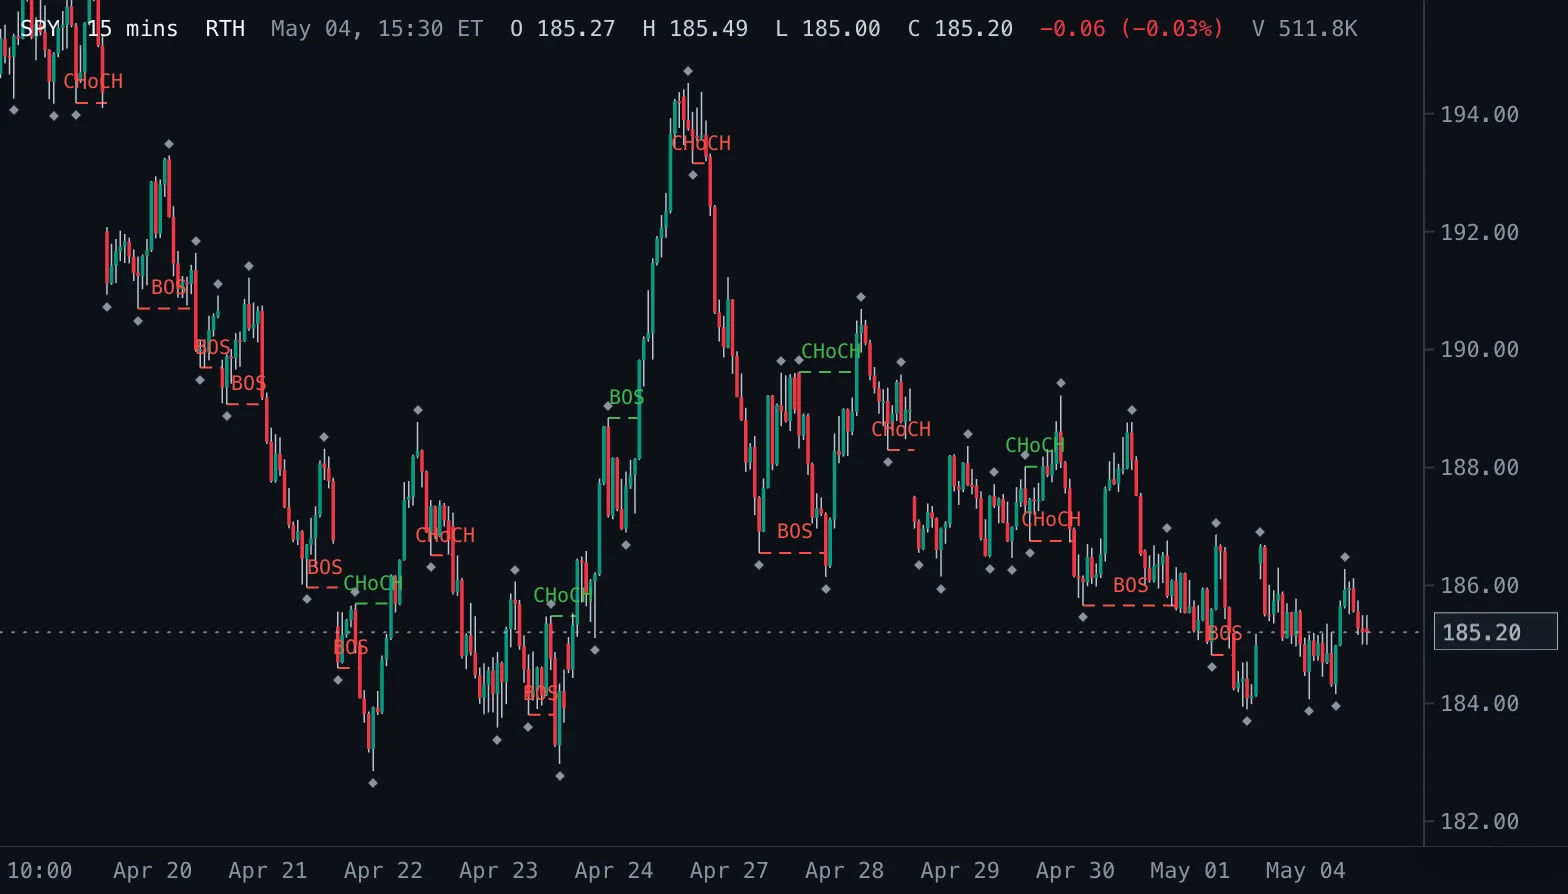
Swing highs and lows from fractal pivots, and a line with a BOS or CHoCH label wherever a close breaks the last swing: with the trend a break of structure, against it a change of character.