Linear Regression Channel
The best-fit straight line through the last bars, with a channel a chosen number of standard deviations around it.
- LRC
- Built into Spectral
- Updates every tick
- linear regression
- regression channel
- trend
- standard deviation
- channel
- least squares
MIT-0: free to use, change and share, no attribution needed. What you build from it is yours.
Already in Spectral: add it from the Indicators toolbox. The file here is the same indicator written as a custom indicator, to change or learn from. Installed, it appears next to the built-in one, marked Custom.
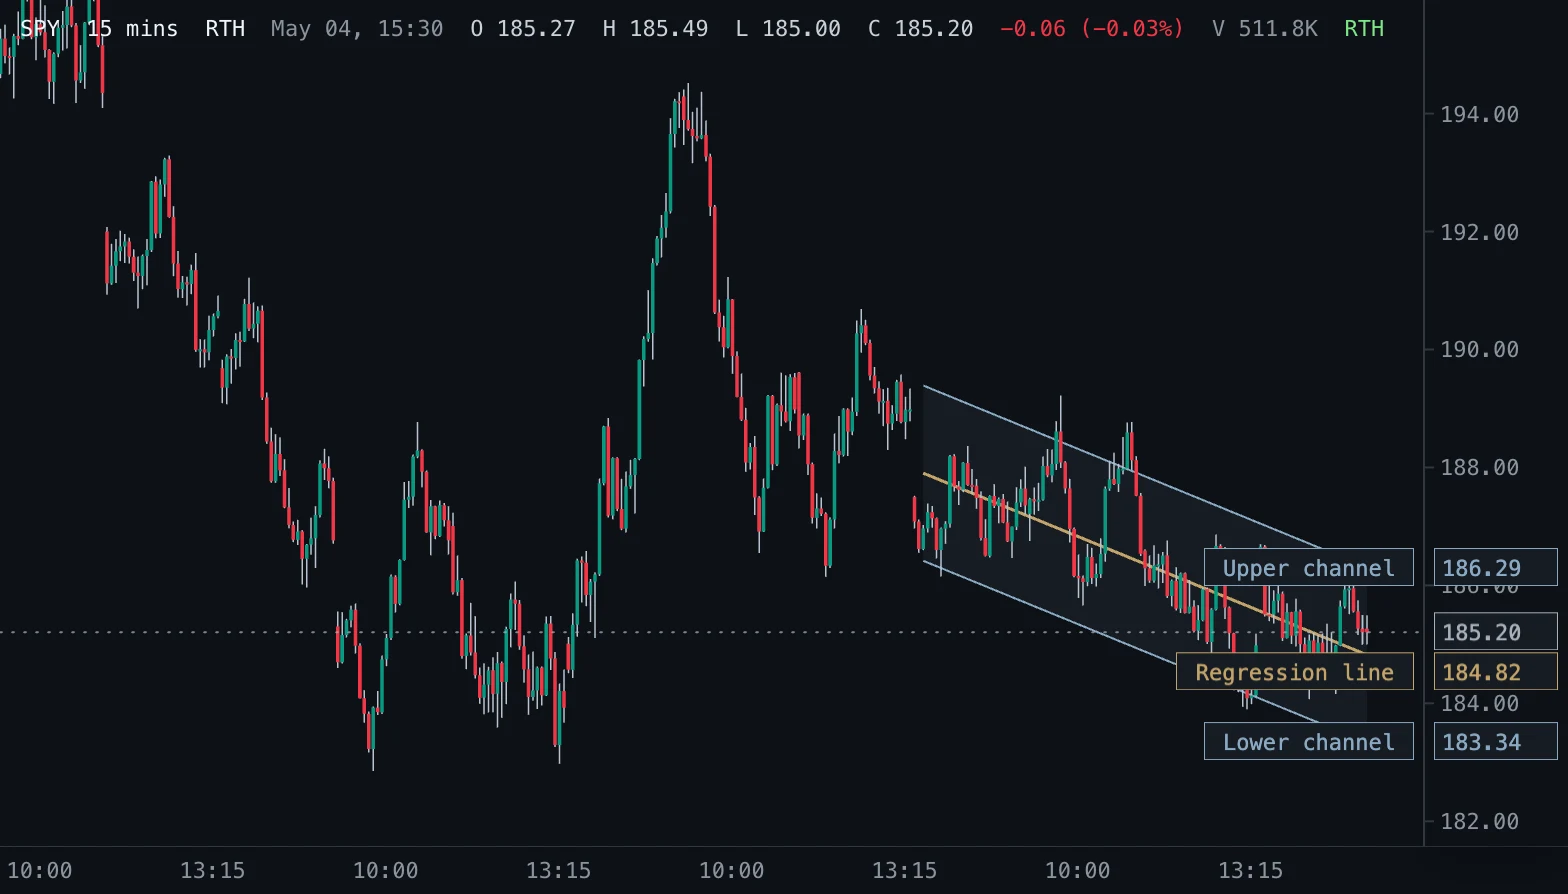
Overview
The Linear Regression Channel fits the straight line that best follows price over the last Length bars (least squares on the source), and draws channel lines a number of standard deviations above and below it. The standard deviation is measured from price to the line, so the channel shows how tightly price has followed the trend.
The channel covers only the last Length bars: it describes the current window, not the history.
How to read it
The slope of the line is the trend of the window: rising, falling or flat. Price near the upper channel line is stretched above the trend, near the lower line below it; with two standard deviations, most of the window's closes lie inside the channel, so touches of the outer lines often stall or reverse while the trend holds.
A close well outside the channel, or a channel that suddenly turns, means the trend the line describes has changed. A narrow channel means price has followed the line closely; a wide one, a loose and noisy trend.
Settings and limitations
Length sets the window: 100 bars by default, shorter for the most recent swing, longer for the larger trend. Upper deviation and Lower deviation set each channel line separately; 2 is standard, and 0 hides that line.
The whole channel is refitted when each bar completes, so its past position changes: it is a description of the current window, not a signal history. While a bar forms, its own point follows every price change (fitted over the window that ends with it), and the rest of the channel is redrawn when the bar completes. It is drawn once the chart has at least Length bars.
Notes
Matches TradingView's Linear Regression Channel: the same least-squares line, and the standard deviation of price around the line divided by Length minus one. TradingView can also extend the lines into the future and print the Pearson correlation; Spectral draws the channel over the window only.
Settings
Each setting appears in the indicator's settings panel in Spectral, next to a color setting for every output.
| Setting | Type | Default | Range or options | What it does |
|---|---|---|---|---|
| Length | Whole number | 100 | 2 – 5000 | Bars the regression line is fitted to, counting back from the last bar. |
| Source | Price source | close | open, high, low, close, hlc3 | Price the line is fitted to. |
| Upper deviation | Number | 2 | 0 – 10, step 0.1 | Distance of the upper channel line above the regression line, in standard deviations of price around the line. 0 hides the upper line. |
| Lower deviation | Number | 2 | 0 – 10, step 0.1 | Distance of the lower channel line below the regression line, in standard deviations of price around the line. 0 hides the lower line. |
Presets
Each preset is its own entry in the Indicators toolbox, with these settings changed.
| Toolbox entry | Short name | Settings |
|---|---|---|
| Linear Regression Channel (50) | LRC 50 | Length: 50 |
| Linear Regression Channel (200) | LRC 200 | Length: 200 |
What it draws
Lines
- Regression linesolid · 1.5 px · primary
#C4A46A - Upper channelsolid · 1 px
#8AA9C3 - Lower channelsolid · 1 px
#8AA9C3
Zones
- Channel fillfilled at 7% opacity
#8AA9C3
Source
Save it as linear-regression-channel.js and add it with Indicators → Custom indicators → Add file…. The format is explained in the custom indicators guide.
// Copyright (c) 2026 Spectral
// SPDX-License-Identifier: MIT-0
// Free to use, copy, modify and share: https://spectral.trade/docs/custom-indicators/LICENSE.txt
/** @type {import('./spectral-indicator').IndicatorV2} */
export default {
  schemaVersion: 2,
  id: 'linear-regression-channel',
  name: 'Linear Regression Channel',
  shortName: 'LRC',
  version: '1.0.0',
  author: 'Spectral',
  description: 'The best-fit straight line through the last bars, with a channel a chosen number of standard deviations around it.',
  pane: 'price',
  live: { lookback: 'length' },
  inputs: {
    length: { type: 'integer', label: 'Length', default: 100, min: 2, max: 5000, description: 'Bars the regression line is fitted to, counting back from the last bar.' },
    source: { type: 'source', label: 'Source', default: 'close', description: 'Price the line is fitted to.' },
    upperDeviation: { type: 'number', label: 'Upper deviation', default: 2, min: 0, max: 10, step: 0.1, description: 'Distance of the upper channel line above the regression line, in standard deviations of price around the line. 0 hides the upper line.' },
    lowerDeviation: { type: 'number', label: 'Lower deviation', default: 2, min: 0, max: 10, step: 0.1, description: 'Distance of the lower channel line below the regression line, in standard deviations of price around the line. 0 hides the lower line.' },
  },
  plots: {
    regression: { label: 'Regression line', color: '#C4A46A', lineWidth: 1.5, primary: true },
    upper: { label: 'Upper channel', color: '#8AA9C3', lineWidth: 1 },
    lower: { label: 'Lower channel', color: '#8AA9C3', lineWidth: 1 },
  },
  zones: {
    channel: { label: 'Channel fill', color: '#8AA9C3', opacity: 0.07 },
  },
  presets: [
    { id: 'lrc-50', name: 'Linear Regression Channel (50)', shortName: 'LRC 50', inputs: { length: 50 } },
    { id: 'lrc-200', name: 'Linear Regression Channel (200)', shortName: 'LRC 200', inputs: { length: 200 } },
  ],
  docs: {
    overview: 'The Linear Regression Channel fits the straight line that best follows price over the last Length bars (least squares on the source), and draws channel lines a number of standard deviations above and below it. The standard deviation is measured from price to the line, so the channel shows how tightly price has followed the trend.\n\nThe channel covers only the last Length bars: it describes the current window, not the history.',
    howToRead: 'The slope of the line is the trend of the window: rising, falling or flat. Price near the upper channel line is stretched above the trend, near the lower line below it; with two standard deviations, most of the window\'s closes lie inside the channel, so touches of the outer lines often stall or reverse while the trend holds.\n\nA close well outside the channel, or a channel that suddenly turns, means the trend the line describes has changed. A narrow channel means price has followed the line closely; a wide one, a loose and noisy trend.',
    settings: 'Length sets the window: 100 bars by default, shorter for the most recent swing, longer for the larger trend. Upper deviation and Lower deviation set each channel line separately; 2 is standard, and 0 hides that line.\n\nThe whole channel is refitted when each bar completes, so its past position changes: it is a description of the current window, not a signal history. While a bar forms, its own point follows every price change (fitted over the window that ends with it), and the rest of the channel is redrawn when the bar completes. It is drawn once the chart has at least Length bars.',
    notes: 'Matches TradingView\'s Linear Regression Channel: the same least-squares line, and the standard deviation of price around the line divided by Length minus one. TradingView can also extend the lines into the future and print the Pearson correlation; Spectral draws the channel over the window only.',
  },
  calculate(ctx) {
    const { bars, inputs, ta } = ctx;
    const empty = () => bars.map(() => null);
    const regression = empty();
    const upper = empty();
    const lower = empty();
    const length = inputs.length;
    const start = bars.length - length;
    if (start >= 0) {
      const source = ta.source(bars, inputs.source);
      // Least squares with x = 0 .. length - 1 across the window.
      let sumX = 0;
      let sumY = 0;
      let sumXY = 0;
      let sumXX = 0;
      for (let x = 0; x < length; x += 1) {
        const y = source[start + x];
        sumX += x;
        sumY += y;
        sumXY += x * y;
        sumXX += x * x;
      }
      const slope = (length * sumXY - sumX * sumY) / (length * sumXX - sumX * sumX);
      const intercept = (sumY - slope * sumX) / length;
      let squares = 0;
      for (let x = 0; x < length; x += 1) {
        const residual = source[start + x] - (intercept + slope * x);
        squares += residual * residual;
      }
      const deviation = Math.sqrt(squares / (length - 1));
      for (let x = 0; x < length; x += 1) {
        const value = intercept + slope * x;
        regression[start + x] = value;
        if (inputs.upperDeviation > 0) upper[start + x] = value + inputs.upperDeviation * deviation;
        if (inputs.lowerDeviation > 0) lower[start + x] = value - inputs.lowerDeviation * deviation;
      }
    }
    const channelUpper = upper.map((value, index) => (value === null ? regression[index] : value));
    const channelLower = lower.map((value, index) => (value === null ? regression[index] : value));
    return { plots: { regression, upper, lower }, zones: { channel: { upper: channelUpper, lower: channelLower } } };
  },
};
Adapt it with an LLM
Paste this into your assistant and replace the second-to-last line with the change you want.
Start from this Spectral custom indicator: https://spectral.trade/indicators/linear-regression-channel.js
Format reference: https://spectral.trade/docs/custom-indicators.llm.md
Keep the file format and every rule of the reference; give the result a new id, name, shortName and version, and update docs and input descriptions to match.
Keep its live updates exact and fast (section "Fast live updates" of the reference): carry values from bar to bar only through ctx.ta, and raise live.lookback if the change reads further back; Spectral rejects a file whose live updates differ from a full recalculation or are too slow.
Change I want: <describe the change>
Answer with the complete file in one code block, ready to save as <id>.js.
Related indicators
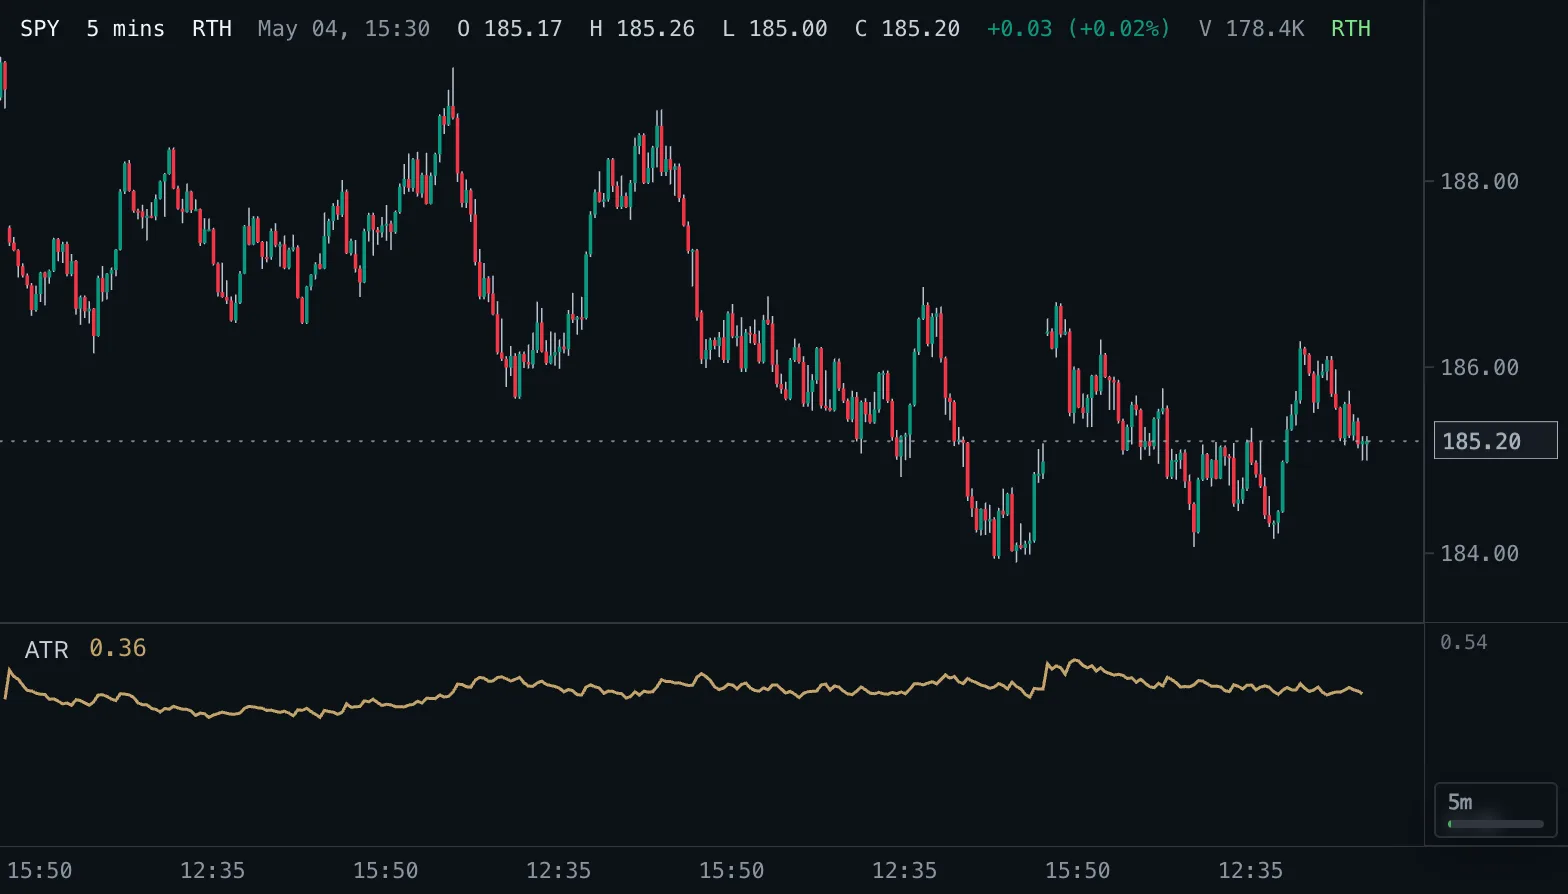
Average True Range ATR
Average True Range: the average size of a bar including gaps, in price units, with Wilder smoothing by default.
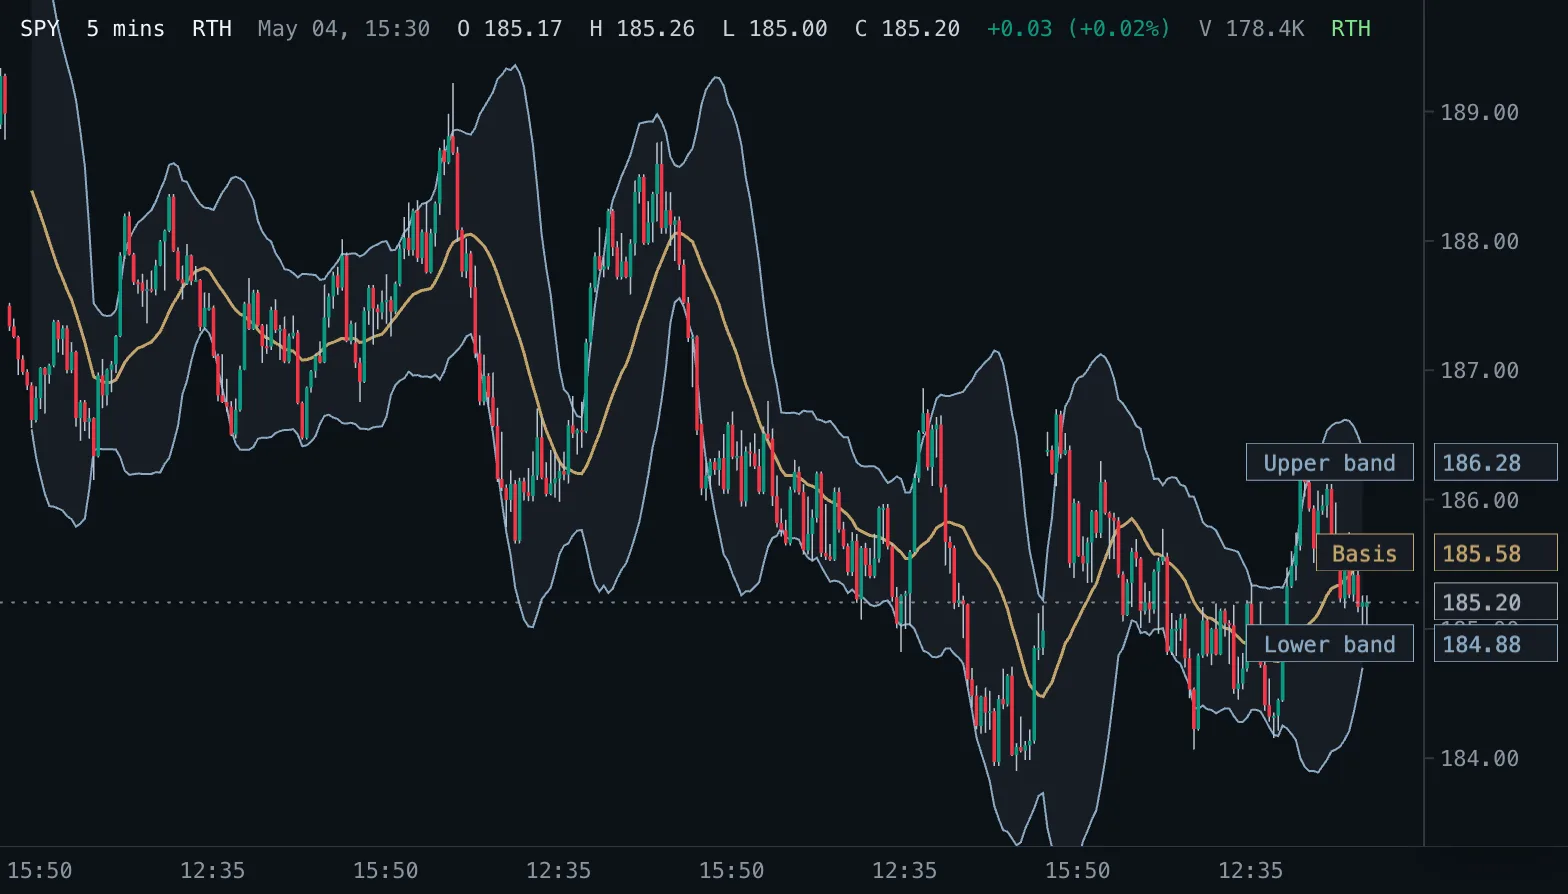
Bollinger Bands BB
A moving average with bands a chosen number of standard deviations above and below it, so the band width follows volatility.
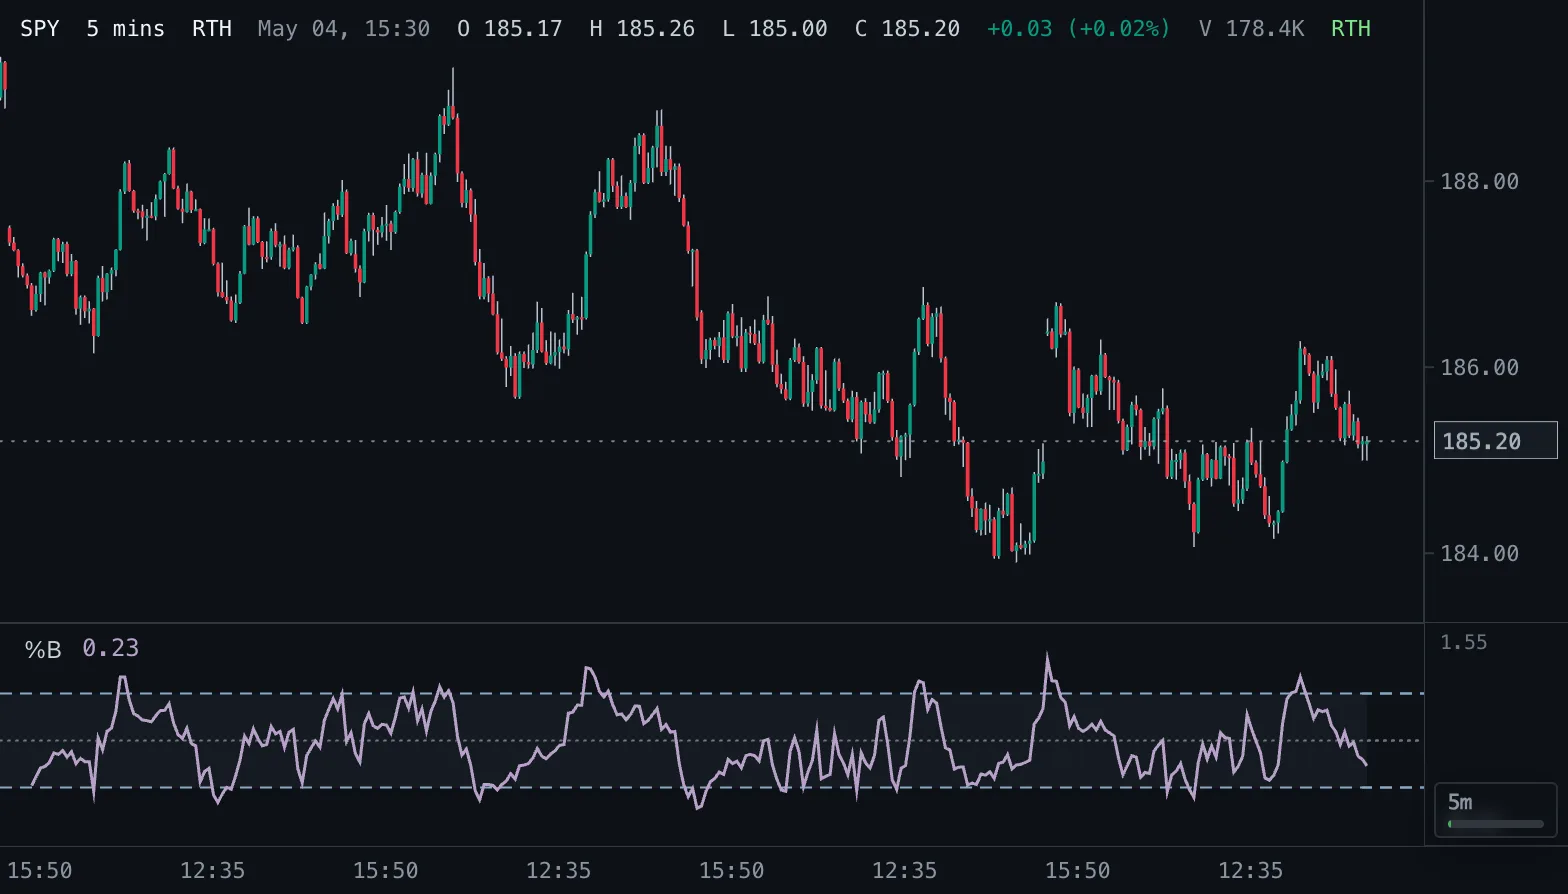
Bollinger %B %B
Where price sits within its Bollinger Bands: 1 at the upper band, 0.5 at the basis, 0 at the lower band.