McGinley Dynamic
John McGinley's self-adjusting moving average that speeds up when price falls away from it and avoids whipsaws, drawn on the candles.
- MD
- Built into Spectral
- Updates every tick
- mcginley
- dynamic
- adaptive
- moving average
- trend
MIT-0: free to use, change and share, no attribution needed. What you build from it is yours.
Already in Spectral: add it from the Indicators toolbox. The file here is the same indicator written as a custom indicator, to change or learn from. Installed, it appears next to the built-in one, marked Custom.
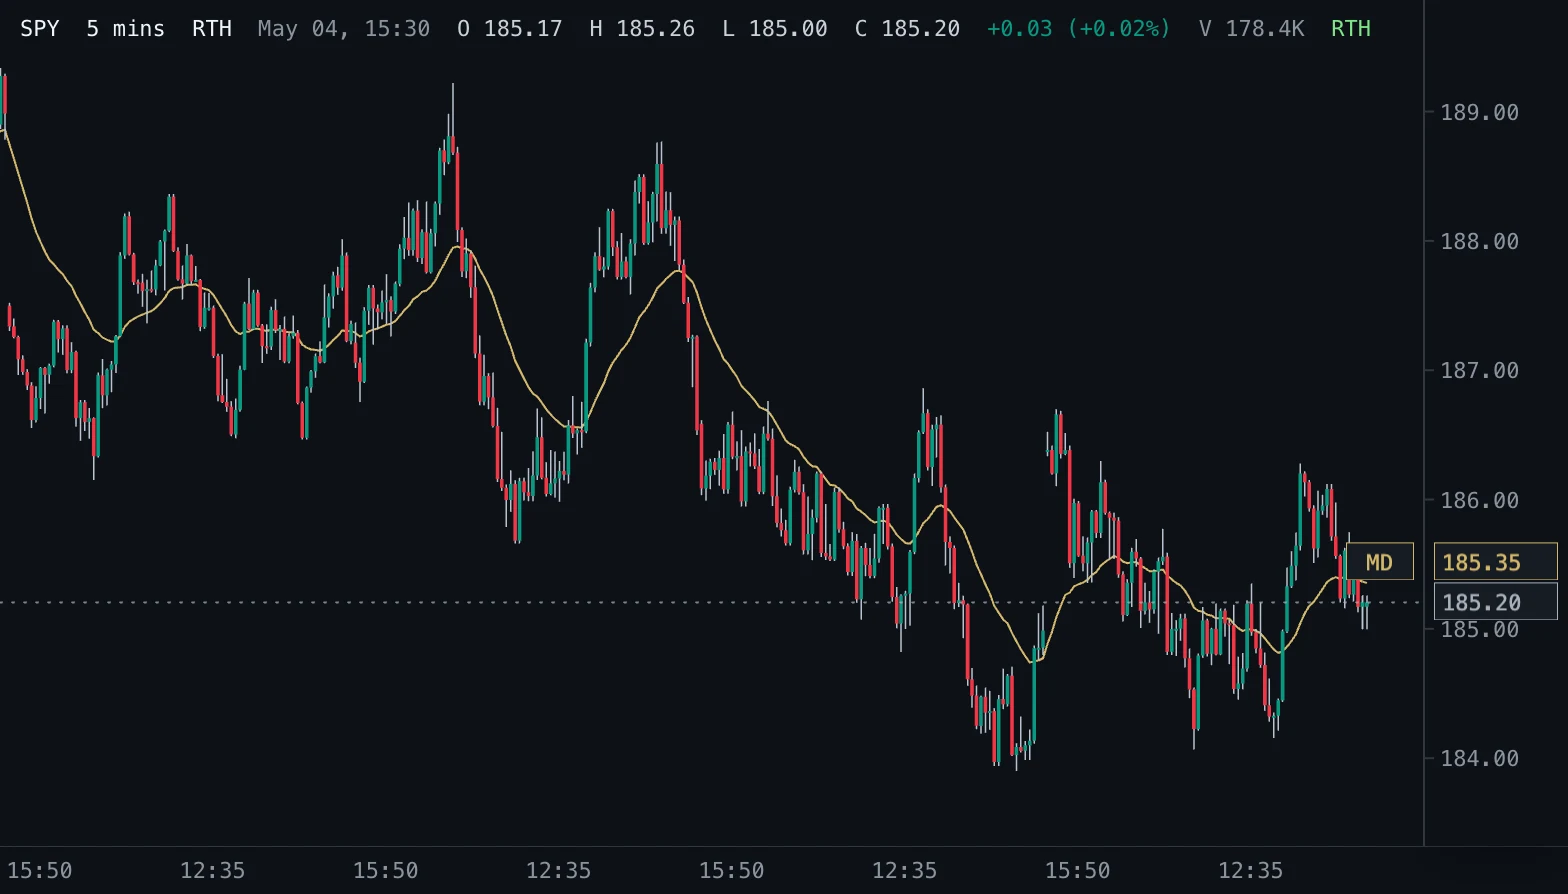
Overview
The McGinley Dynamic, introduced by market technician John R. McGinley in the 1990s, is a moving average that adjusts its own speed. Each bar it moves from its previous value toward price by the gap divided by Length times the fourth power of price over its previous value.
When price is close to the line, it behaves like an exponential average of about Length bars. When price falls well below it, the fourth power shrinks the divisor and the line catches up quickly; when price runs well above it, the line follows more cautiously.
How to read it
McGinley designed it as a smoother, more reliable tracking line than an ordinary average: it hugs price in calm phases and avoids being left far behind after fast moves, so price separating from it is rarer and more telling. Its slope gives the trend direction, and price holding above or below it describes which side is in control.
It reacts faster to drops than to rallies of the same size, a deliberate asymmetry that reflects how quickly markets tend to fall.
Settings and limitations
Length defaults to 14 bars, as on TradingView; the presets add 21 and 50. McGinley suggested a length of about 60% of the moving average you would otherwise use, so 12 instead of a 20-bar average.
The line starts at the first bar with that bar's price and settles within a few multiples of Length.
Notes
Uses the form most platforms use: previous value + (price - previous value) / (Length x (price / previous value) to the fourth power), starting from the first price. TradingView starts it from an exponential average instead, so the earliest values can differ until the line has settled. McGinley's original article also scaled the length by a constant of about 0.6; enter a shorter Length to get the same effect.
Settings
Each setting appears in the indicator's settings panel in Spectral, next to a color setting for every output.
| Setting | Type | Default | Range or options | What it does |
|---|---|---|---|---|
| Length | Whole number | 14 | 1 – 1000 | Base smoothing length in bars. McGinley suggested about 60% of the moving average length you would otherwise use. |
| Source | Price source | close | open, high, low, close, hlc3 | Price the average is calculated from. |
Presets
Each preset is its own entry in the Indicators toolbox, with these settings changed.
| Toolbox entry | Short name | Settings |
|---|---|---|
| McGinley Dynamic 21 | MD 21 | Length: 21 |
| McGinley Dynamic 50 | MD 50 | Length: 50 |
What it draws
Lines
- MDsolid · 1 px · primary
#D4B86A
Source
Save it as mcginley-dynamic.js and add it with Indicators → Custom indicators → Add file…. The format is explained in the custom indicators guide.
// Copyright (c) 2026 Spectral
// SPDX-License-Identifier: MIT-0
// Free to use, copy, modify and share: https://spectral.trade/docs/custom-indicators/LICENSE.txt
/** @type {import('./spectral-indicator').IndicatorV2} */
export default {
  schemaVersion: 2,
  id: 'mcginley-dynamic',
  name: 'McGinley Dynamic',
  shortName: 'MD',
  version: '1.0.0',
  author: 'Spectral',
  description: 'John McGinley\'s self-adjusting moving average that speeds up when price falls away from it and avoids whipsaws, drawn on the candles.',
  pane: 'price',
  live: { lookback: 0 },
  inputs: {
    length: { type: 'integer', label: 'Length', default: 14, min: 1, max: 1000, description: 'Base smoothing length in bars. McGinley suggested about 60% of the moving average length you would otherwise use.' },
    source: { type: 'source', label: 'Source', default: 'close', description: 'Price the average is calculated from.' },
  },
  plots: {
    md: { label: 'MD', color: '#D4B86A', lineWidth: 1, primary: true },
  },
  presets: [
    { id: 'mcginley-21', name: 'McGinley Dynamic 21', shortName: 'MD 21', inputs: { length: 21 } },
    { id: 'mcginley-50', name: 'McGinley Dynamic 50', shortName: 'MD 50', inputs: { length: 50 } },
  ],
  docs: {
    overview: 'The McGinley Dynamic, introduced by market technician John R. McGinley in the 1990s, is a moving average that adjusts its own speed. Each bar it moves from its previous value toward price by the gap divided by Length times the fourth power of price over its previous value.\n\nWhen price is close to the line, it behaves like an exponential average of about Length bars. When price falls well below it, the fourth power shrinks the divisor and the line catches up quickly; when price runs well above it, the line follows more cautiously.',
    howToRead: 'McGinley designed it as a smoother, more reliable tracking line than an ordinary average: it hugs price in calm phases and avoids being left far behind after fast moves, so price separating from it is rarer and more telling. Its slope gives the trend direction, and price holding above or below it describes which side is in control.\n\nIt reacts faster to drops than to rallies of the same size, a deliberate asymmetry that reflects how quickly markets tend to fall.',
    settings: 'Length defaults to 14 bars, as on TradingView; the presets add 21 and 50. McGinley suggested a length of about 60% of the moving average you would otherwise use, so 12 instead of a 20-bar average.\n\nThe line starts at the first bar with that bar\'s price and settles within a few multiples of Length.',
    notes: 'Uses the form most platforms use: previous value + (price - previous value) / (Length x (price / previous value) to the fourth power), starting from the first price. TradingView starts it from an exponential average instead, so the earliest values can differ until the line has settled. McGinley\'s original article also scaled the length by a constant of about 0.6; enter a shorter Length to get the same effect.',
  },
  calculate(ctx) {
    const { bars, inputs, ta } = ctx;
    const values = ta.source(bars, inputs.source);
    const length = inputs.length;
    // The dynamic carries its previous value from bar to bar through ta.scan; it starts at the first price.
    const md = ta.scan(values, null, (previous, price) => {
      if (previous === null) return price;
      const divisor = length * Math.pow(price / previous, 4);
      return divisor > 0 && Number.isFinite(divisor) ? previous + (price - previous) / divisor : price;
    });
    return { plots: { md } };
  },
};
Adapt it with an LLM
Paste this into your assistant and replace the second-to-last line with the change you want.
Start from this Spectral custom indicator: https://spectral.trade/indicators/mcginley-dynamic.js
Format reference: https://spectral.trade/docs/custom-indicators.llm.md
Keep the file format and every rule of the reference; give the result a new id, name, shortName and version, and update docs and input descriptions to match.
Keep its live updates exact and fast (section "Fast live updates" of the reference): carry values from bar to bar only through ctx.ta, and raise live.lookback if the change reads further back; Spectral rejects a file whose live updates differ from a full recalculation or are too slow.
Change I want: <describe the change>
Answer with the complete file in one code block, ready to save as <id>.js.
Related indicators
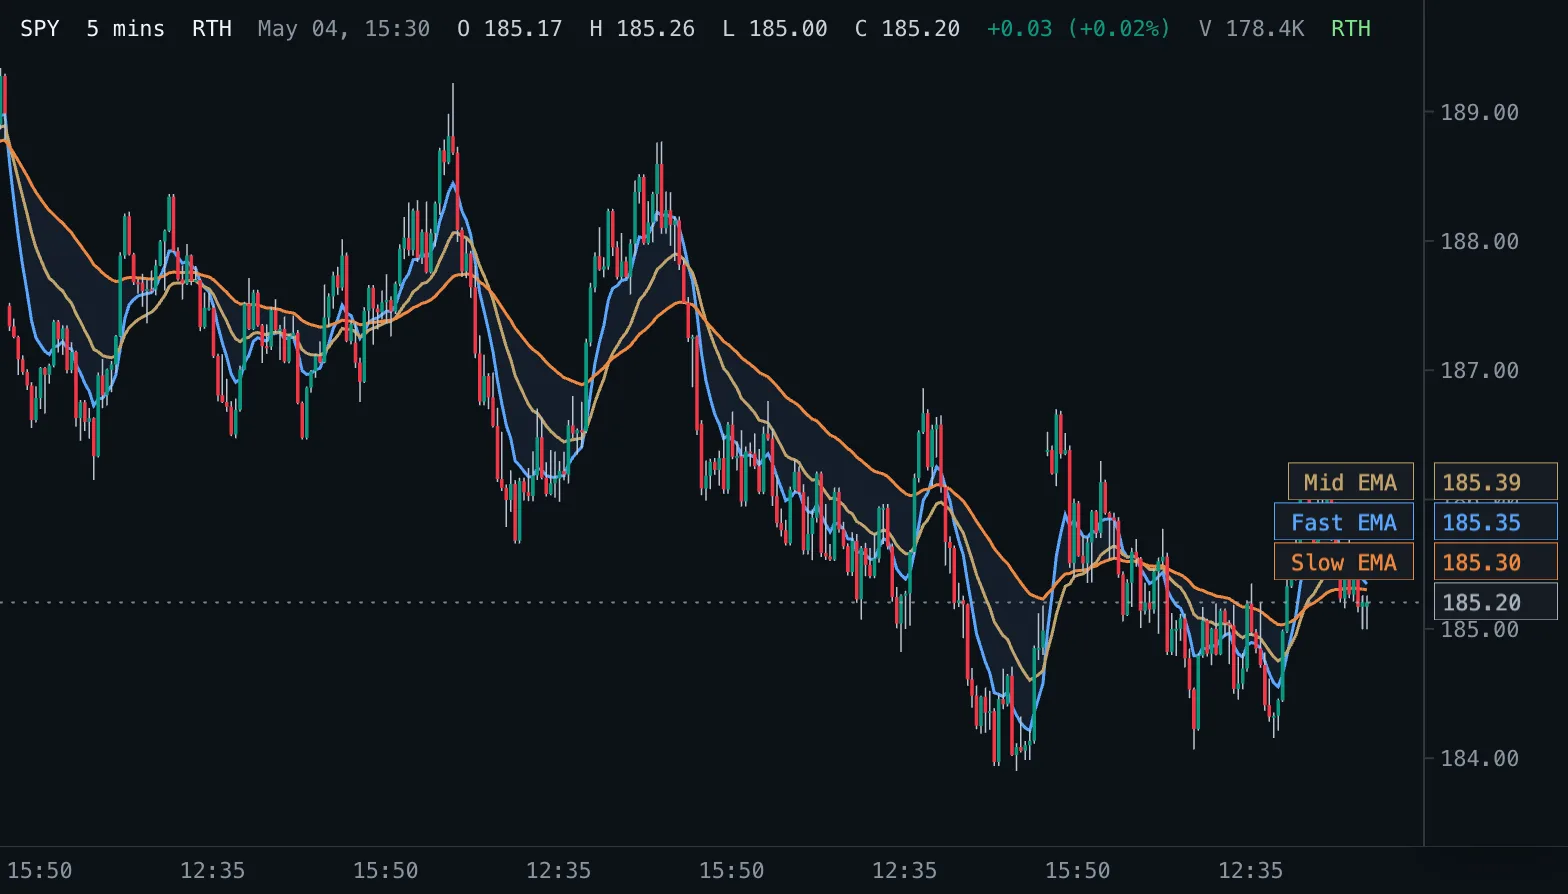
EMA Ribbon Ribbon
Three exponential moving averages on the price pane with a shaded band between the fastest and the slowest.
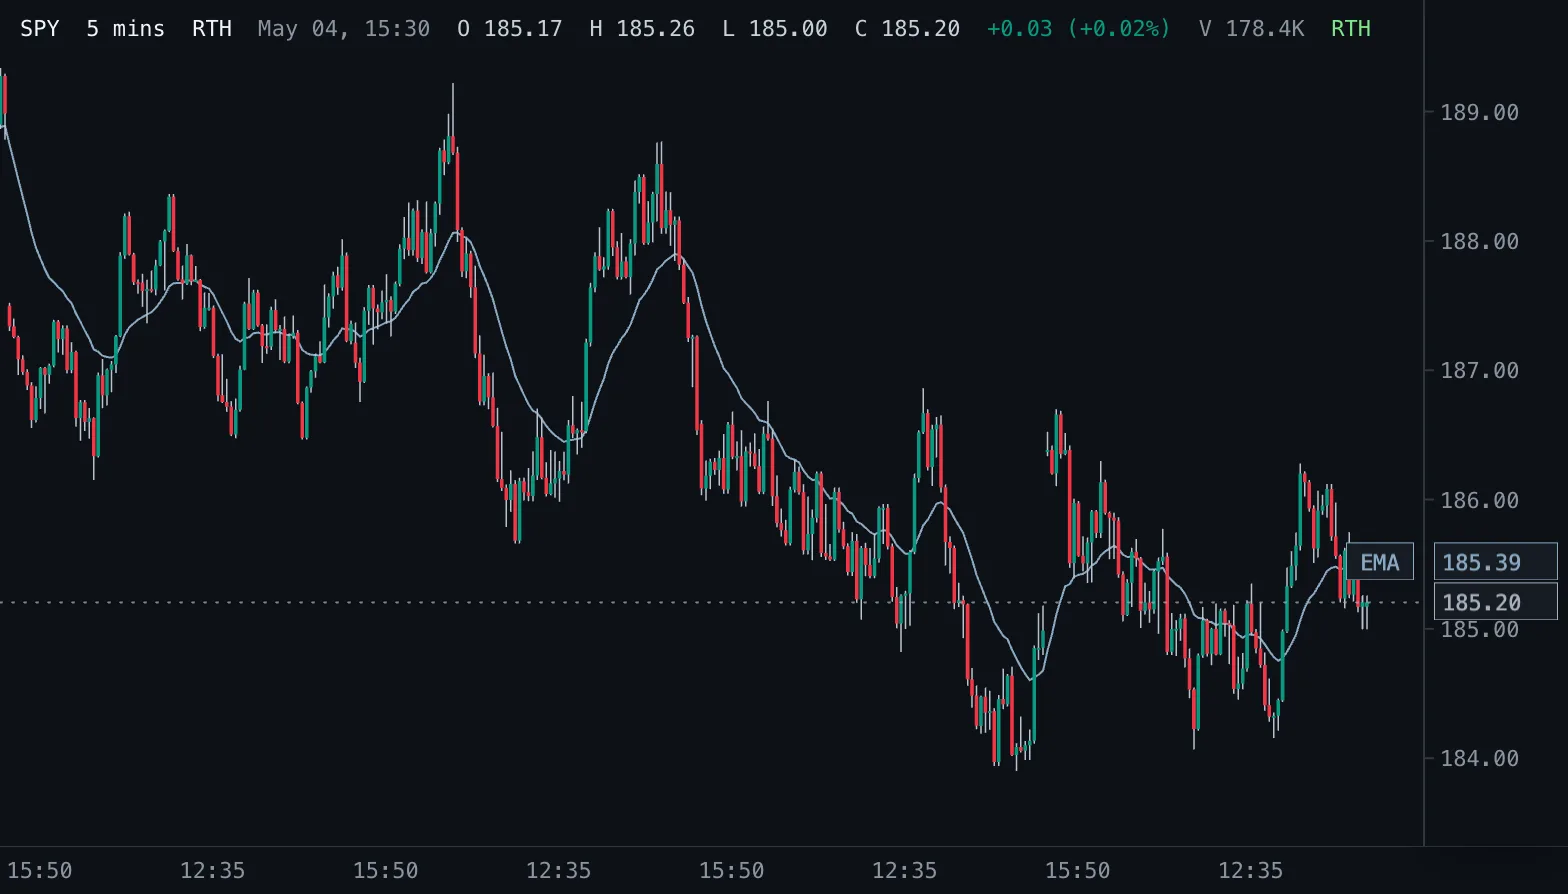
Exponential Moving Average EMA
Exponential moving average of the chosen price, weighting recent bars more, drawn on the candles.
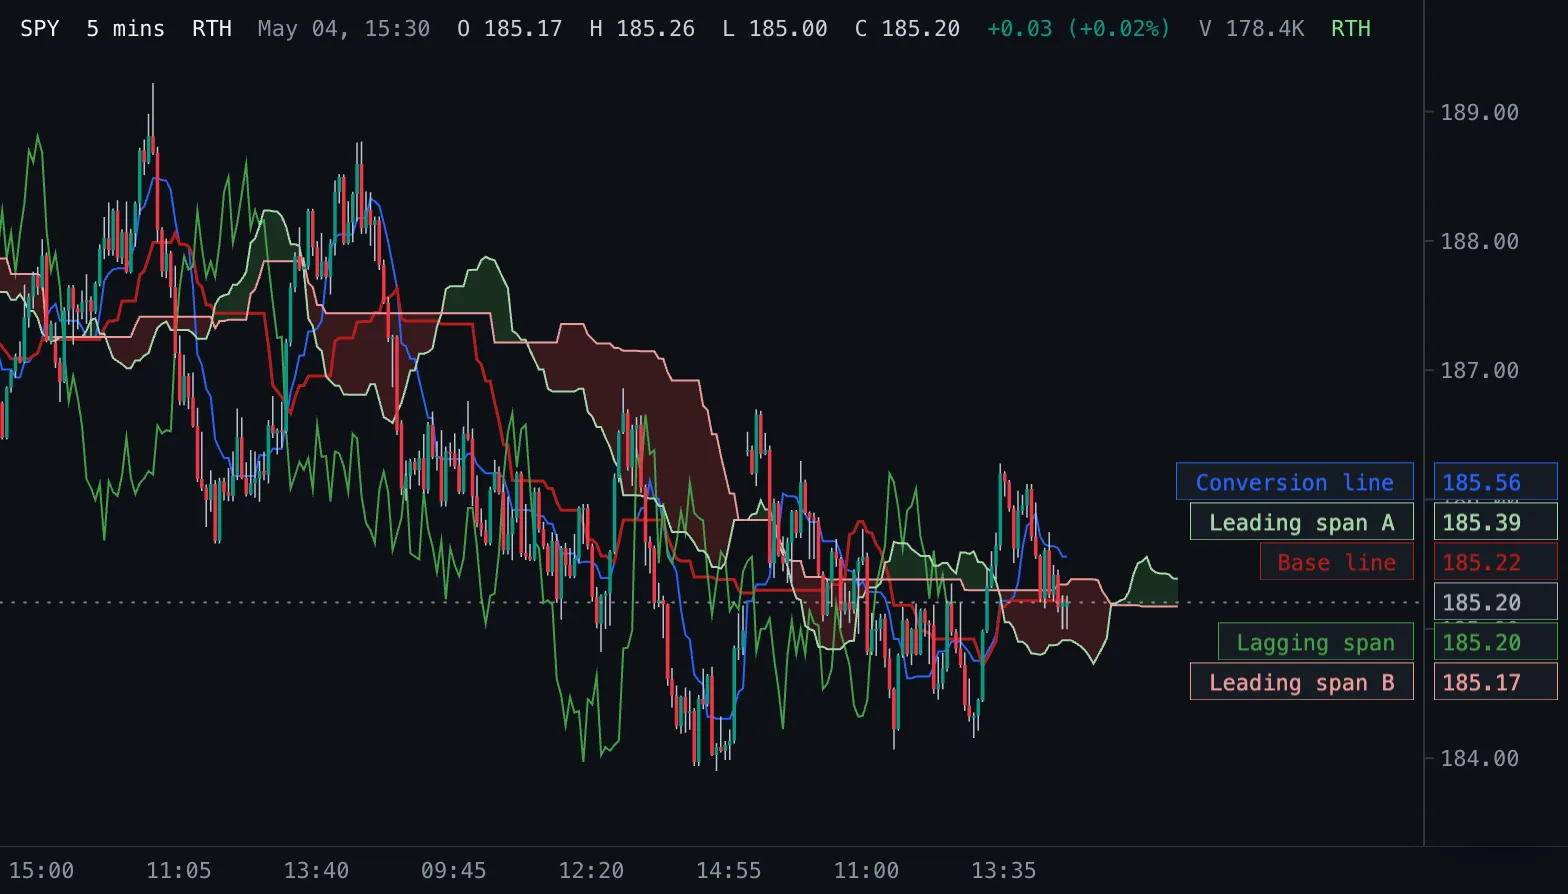
Ichimoku Cloud Ichimoku
Ichimoku Kinko Hyo: conversion and base lines, a cloud of two leading spans projected into the future, and the lagging close.