Pivot Points Standard (Labeled)
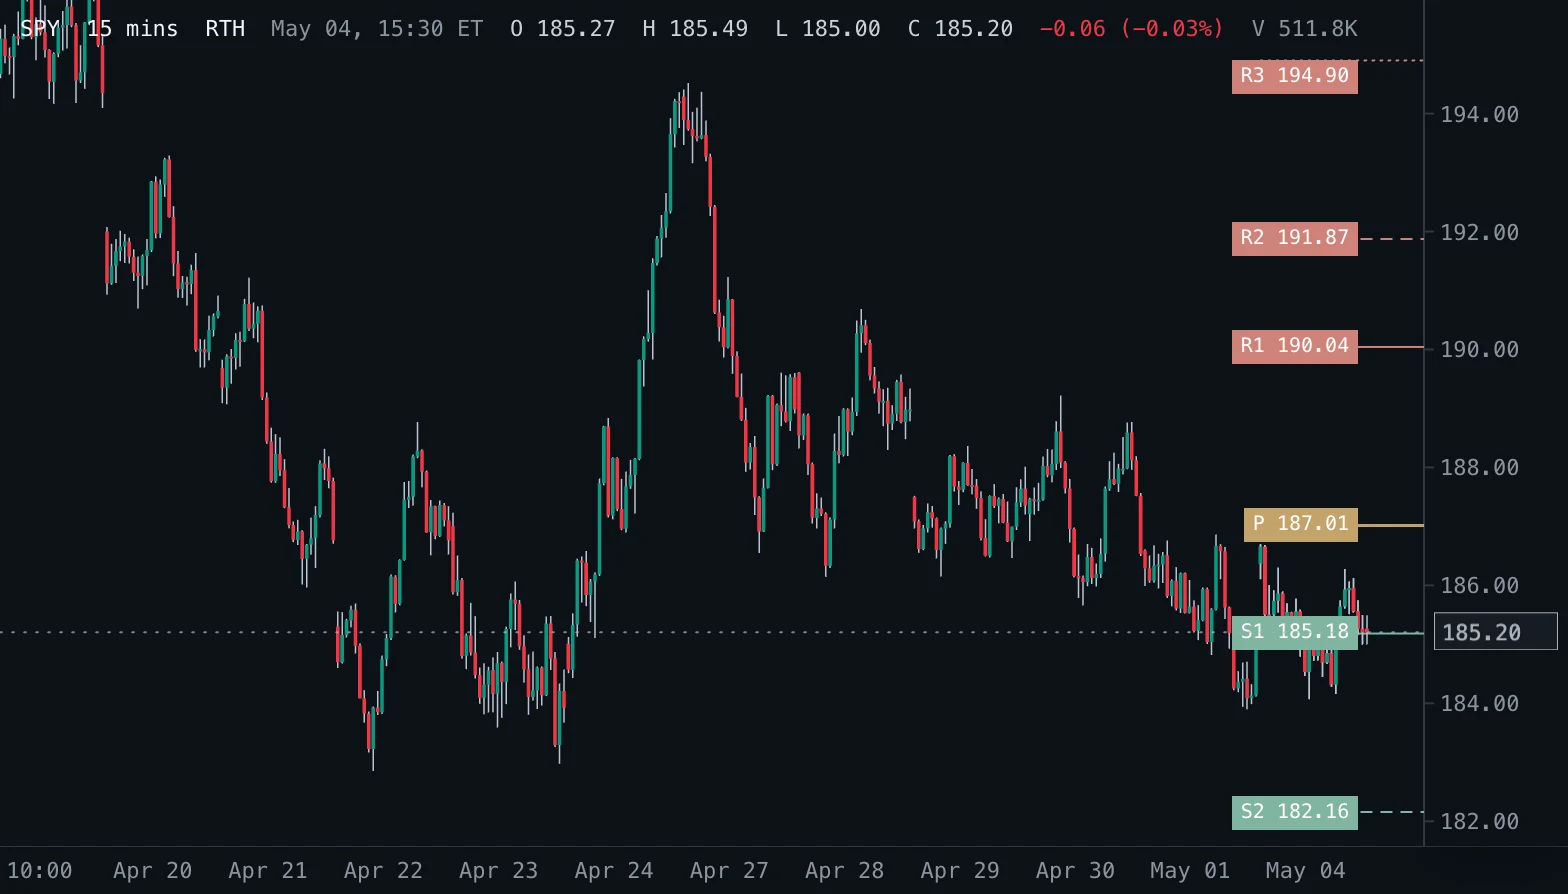
Standard (floor trader) daily pivot point with three resistance and three support levels from the previous regular session, each named with its price at the right edge.
- Pivots
- Updates every tick
- pivot points
- floor trader
- support
- resistance
- daily
- labels
MIT-0: free to use, change and share, no attribution needed. What you build from it is yours.
Overview
The standard (floor trader) pivot points of the day: the pivot P is the average of the previous regular session's high, low and close, R1 to R3 lie above it and S1 to S3 below it. Each level is drawn from the start of the current New York trading day and named with its price at the right edge of the chart.
How to read it
P is the balance point of the previous session: trading above it leans bullish for the day, below it bearish. R1 and S1 are the first areas where moves often pause or turn, R2 and S2 are reached on stronger days and R3 and S3 mark an unusually wide range. The levels are reference prices, not signals: look for a reaction, acceptance or rejection before acting.
Settings and limitations
Prices in labels adds each level's price to its name. R3 and S3 turns the outer levels off. The colours of the pivot, resistance and support labels and every line are appearance settings.
The previous session's high, low and close come from daily regular-trading-hours bars that Spectral loads beside the chart (the last month), so the levels are the same on every intraday bar size; the close is the 16:00 close (13:00 on early-close days). Weekly and monthly charts have no previous day and show nothing.
Notes
Formulas (StockCharts ChartSchool, TradingView Pivot Points Standard, Traditional): P = (H + L + C) / 3, R1 = 2P - L, S1 = 2P - H, R2 = P + (H - L), S2 = P - (H - L), R3 = H + 2(P - L), S3 = L - 2(H - P), with H, L and C the previous regular session's high, low and close. The previous session is the last daily bar before the New York date of the chart's latest bar, so before the open an extended-hours chart already shows the levels for the coming session. For Fibonacci, Camarilla, Woodie and weekly or monthly pivots use the built-in Pivot Points.
Settings
Each setting appears in the indicator's settings panel in Spectral, next to a color setting for every output.
| Setting | Type | Default | Range or options | What it does |
|---|---|---|---|---|
| Prices in labels | On / off | On | — | Write each level's price next to its name. |
| R3 and S3 | On / off | On | — | Draw the outer levels R3 and S3. |
What it draws
Levels
- Psolid · 1.5 px
#C4A46A - R1solid · 1 px
#D0837A - R2dashed · 1 px
#D0837A - R3dotted · 1 px
#D0837A - S1solid · 1 px
#7FB5A0 - S2dashed · 1 px
#7FB5A0 - S3dotted · 1 px
#7FB5A0
Text labels
- Level namesbox label · left · colors from Level colors (3 colors)
#C4A46A #D0837A #7FB5A0
Source
Save it as pivot-points-standard-labels.js and add it with Indicators → Custom indicators → Add file…. The format is explained in the custom indicators guide.
// Copyright (c) 2026 Spectral
// SPDX-License-Identifier: MIT-0
// Free to use, copy, modify and share: https://spectral.trade/docs/custom-indicators/LICENSE.txt
/** @type {import('./spectral-indicator').IndicatorV3} */
export default {
  schemaVersion: 3,
  id: 'pivot-points-standard-labels',
  name: 'Pivot Points Standard (Labeled)',
  shortName: 'Pivots',
  version: '1.0.0',
  author: 'Spectral',
  description: 'Standard (floor trader) daily pivot point with three resistance and three support levels from the previous regular session, each named with its price at the right edge.',
  pane: 'price',
  live: { lookback: 0 },
  inputs: {
    showPrice: { type: 'boolean', label: 'Prices in labels', default: true, description: 'Write each level\'s price next to its name.' },
    showOuter: { type: 'boolean', label: 'R3 and S3', default: true, description: 'Draw the outer levels R3 and S3.' },
  },
  palettes: {
    side: { label: 'Level colors', colors: ['#C4A46A', '#D0837A', '#7FB5A0'] },
  },
  levels: {
    pivot: { label: 'P', color: '#C4A46A', lineWidth: 1.5, lineStyle: 'solid' },
    r1: { label: 'R1', color: '#D0837A', lineStyle: 'solid' },
    r2: { label: 'R2', color: '#D0837A', lineStyle: 'dashed' },
    r3: { label: 'R3', color: '#D0837A', lineStyle: 'dotted' },
    s1: { label: 'S1', color: '#7FB5A0', lineStyle: 'solid' },
    s2: { label: 'S2', color: '#7FB5A0', lineStyle: 'dashed' },
    s3: { label: 'S3', color: '#7FB5A0', lineStyle: 'dotted' },
  },
  labels: {
    names: { label: 'Level names', color: '#C4A46A', palette: 'side', style: 'box', placement: 'left', textSize: 'small' },
  },
  auxiliary: {
    daily: { barSize: '1 day', duration: '1 M', useRth: true, keepUpToDate: true },
  },
  docs: {
    overview: 'The standard (floor trader) pivot points of the day: the pivot P is the average of the previous regular session\'s high, low and close, R1 to R3 lie above it and S1 to S3 below it. Each level is drawn from the start of the current New York trading day and named with its price at the right edge of the chart.',
    howToRead: 'P is the balance point of the previous session: trading above it leans bullish for the day, below it bearish. R1 and S1 are the first areas where moves often pause or turn, R2 and S2 are reached on stronger days and R3 and S3 mark an unusually wide range. The levels are reference prices, not signals: look for a reaction, acceptance or rejection before acting.',
    settings: 'Prices in labels adds each level\'s price to its name. R3 and S3 turns the outer levels off. The colours of the pivot, resistance and support labels and every line are appearance settings.\n\nThe previous session\'s high, low and close come from daily regular-trading-hours bars that Spectral loads beside the chart (the last month), so the levels are the same on every intraday bar size; the close is the 16:00 close (13:00 on early-close days). Weekly and monthly charts have no previous day and show nothing.',
    notes: 'Formulas (StockCharts ChartSchool, TradingView Pivot Points Standard, Traditional): P = (H + L + C) / 3, R1 = 2P - L, S1 = 2P - H, R2 = P + (H - L), S2 = P - (H - L), R3 = H + 2(P - L), S3 = L - 2(H - P), with H, L and C the previous regular session\'s high, low and close. The previous session is the last daily bar before the New York date of the chart\'s latest bar, so before the open an extended-hours chart already shows the levels for the coming session. For Fibonacci, Camarilla, Woodie and weekly or monthly pivots use the built-in Pivot Points.',
  },
  calculate(ctx) {
    const { bars, inputs, time, auxiliary, barSize, format } = ctx;
    const empty = { pivot: null, r1: null, r2: null, r3: null, s1: null, s2: null, s3: null };
    const last = bars.length - 1;
    if (last < 0 || barSize === '1 week' || barSize === '1 month') return { levels: empty, labels: { names: [] } };
    // The last daily bar before the latest chart bar's New York date (the daily series also holds today's bar).
    const today = time.ny(bars[last]).dateKey;
    const daily = auxiliary.daily;
    let previous = null;
    for (let index = daily.length - 1; index >= 0; index -= 1) {
      if (time.ny(daily[index]).dateKey < today) {
        previous = daily[index];
        break;
      }
    }
    if (previous === null) return { levels: empty, labels: { names: [] } };

    const { high, low, close } = previous;
    const pivot = (high + low + close) / 3;
    const values = {
      pivot,
      r1: 2 * pivot - low, s1: 2 * pivot - high,
      r2: pivot + (high - low), s2: pivot - (high - low),
      r3: high + 2 * (pivot - low), s3: low - 2 * (high - pivot),
    };
    const fromTime = time.dayStart(bars[last]);
    const levels = {};
    const names = [];
    for (const key of ['r3', 'r2', 'r1', 'pivot', 's1', 's2', 's3']) {
      if (!inputs.showOuter && (key === 'r3' || key === 's3')) {
        levels[key] = null;
        continue;
      }
      const value = values[key];
      levels[key] = { price: value, fromTime };
      const name = key === 'pivot' ? 'P' : key.toUpperCase();
      names.push({
        index: 'right-edge',
        value,
        text: inputs.showPrice ? `${name} ${format.price(value)}` : name,
        palette: key === 'pivot' ? 0 : key.startsWith('r') ? 1 : 2,
      });
    }
    return { levels, labels: { names } };
  },
};
Adapt it with an LLM
Paste this into your assistant and replace the second-to-last line with the change you want.
Start from this Spectral custom indicator: https://spectral.trade/indicators/pivot-points-standard-labels.js
Format reference: https://spectral.trade/docs/custom-indicators.llm.md
Keep the file format and every rule of the reference; give the result a new id, name, shortName and version, and update docs and input descriptions to match.
Keep its live updates exact and fast (section "Fast live updates" of the reference): carry values from bar to bar only through ctx.ta, and raise live.lookback if the change reads further back; Spectral rejects a file whose live updates differ from a full recalculation or are too slow.
Change I want: <describe the change>
Answer with the complete file in one code block, ready to save as <id>.js.
Related indicators
Daily & Weekly Levels D/W Levels
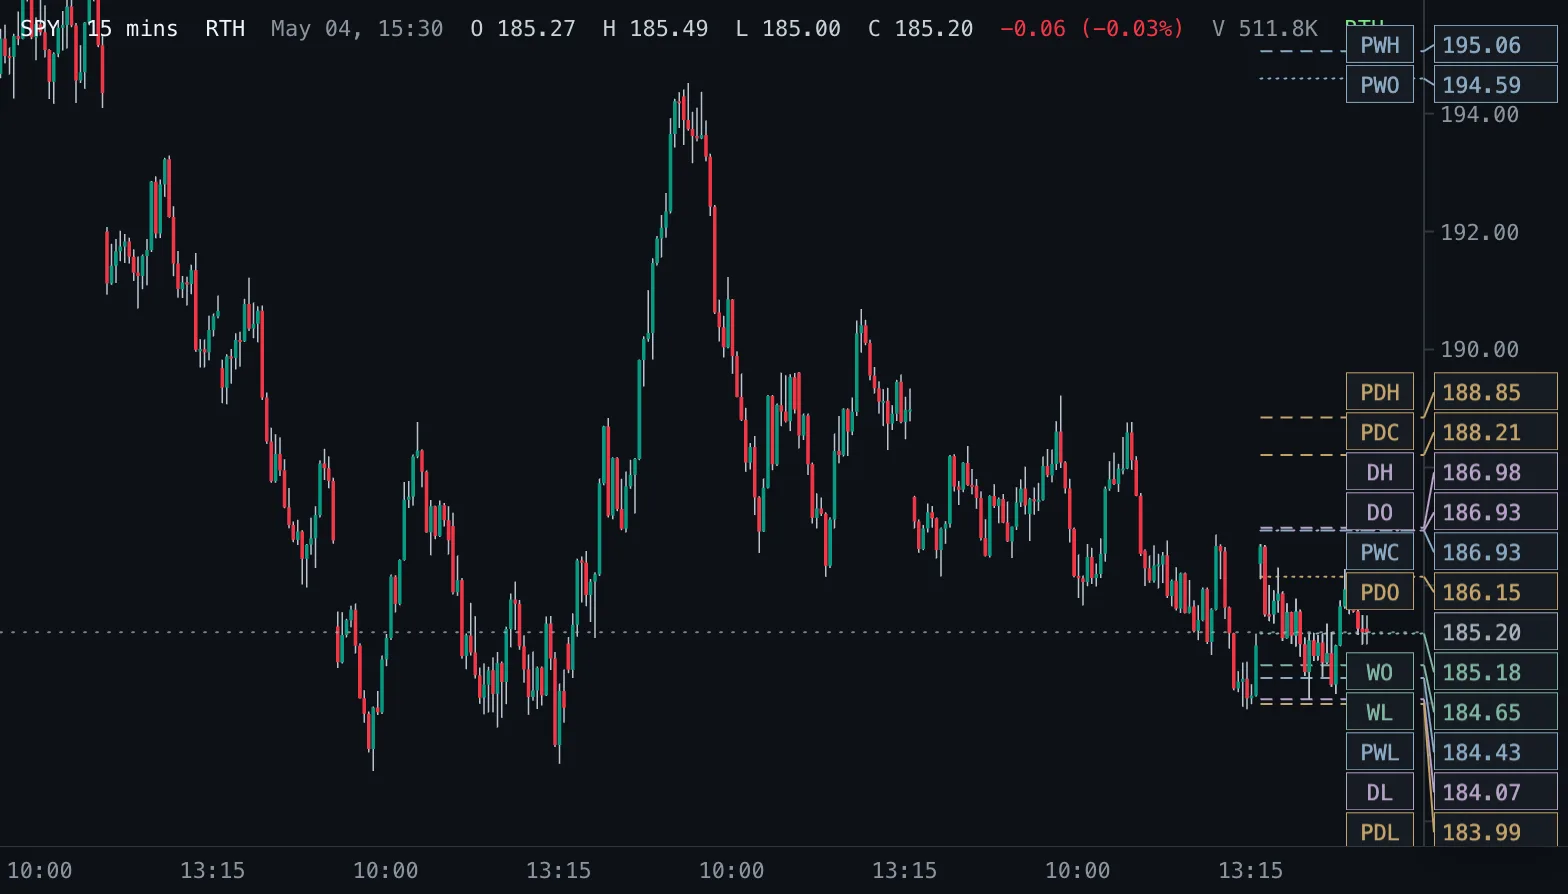
Previous and current day and week open, high, low and close as levels, read from real daily and weekly bars.
Opening Range Breakout ORB
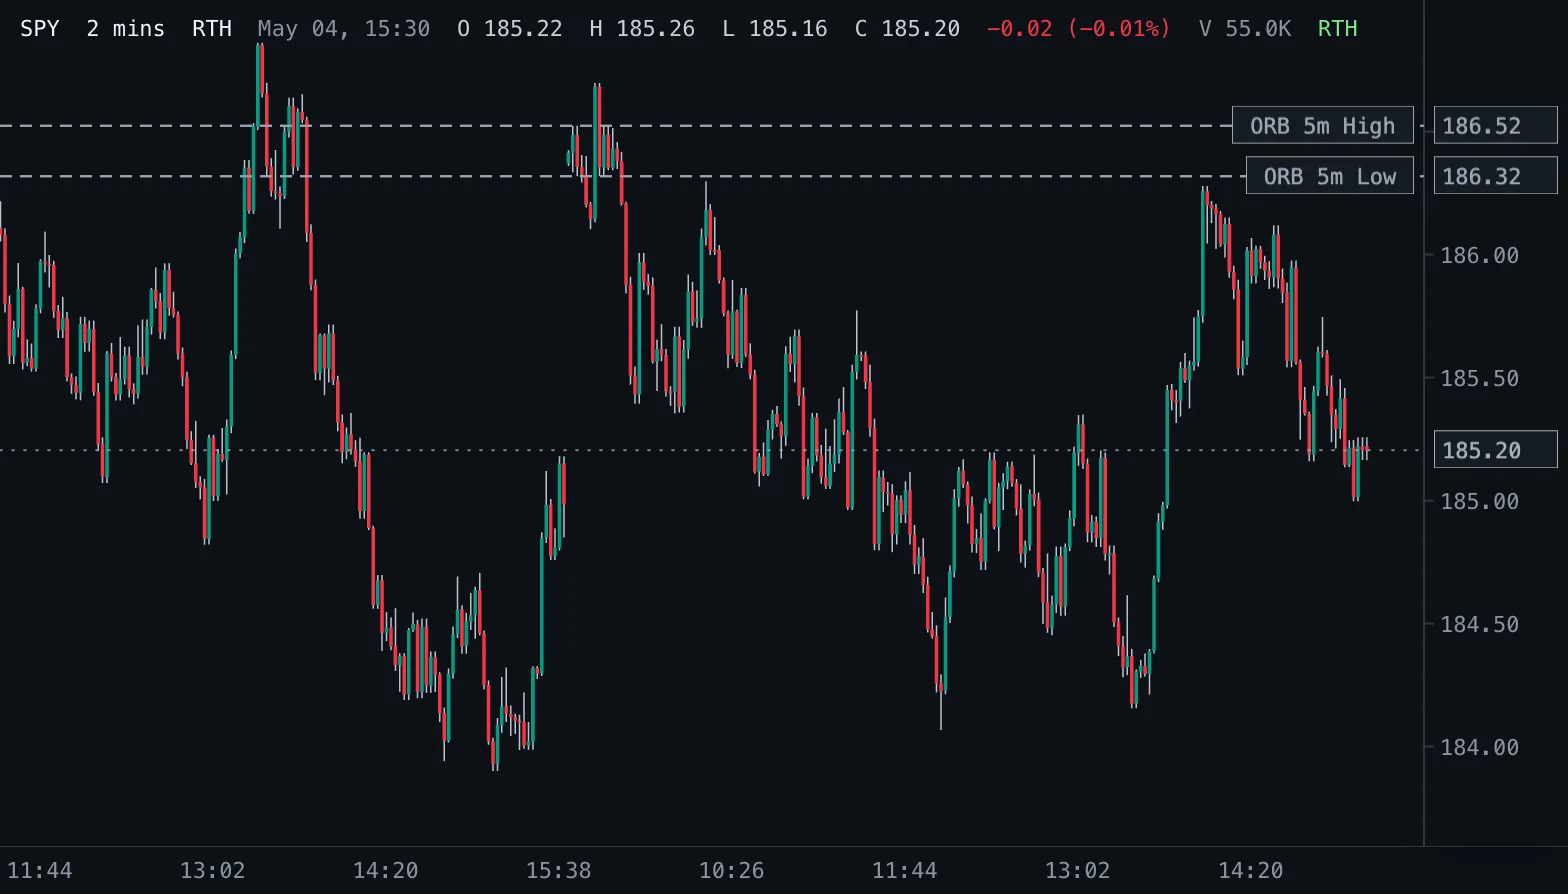
Opening-range highs and lows for 1, 2, 5, 10, 15, 30 and 60 minutes after the 09:30 New York open.
52-Week High/Low 52W H/L
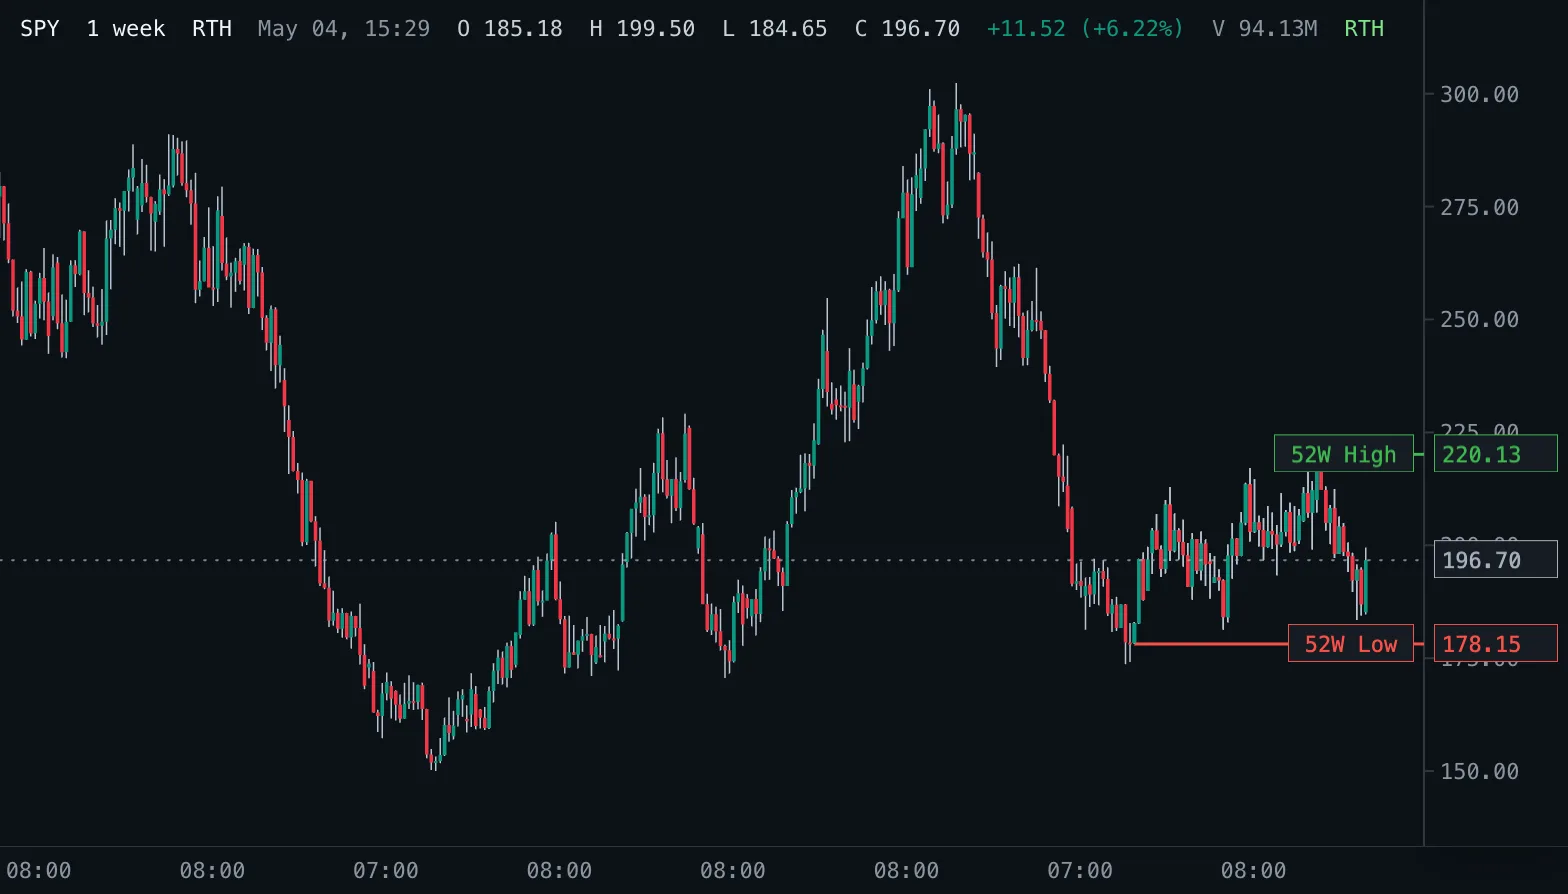
The highest high and lowest low of the last 52 weeks as levels, read from real daily bars.