Simple Moving Average
Simple moving average of the chosen price over a fixed number of bars, drawn on the candles.
- SMA
- Built into Spectral
- Updates every tick
- sma
- moving average
- trend
- average
MIT-0: free to use, change and share, no attribution needed. What you build from it is yours.
Already in Spectral: add it from the Indicators toolbox. The file here is the same indicator written as a custom indicator, to change or learn from. Installed, it appears next to the built-in one, marked Custom.
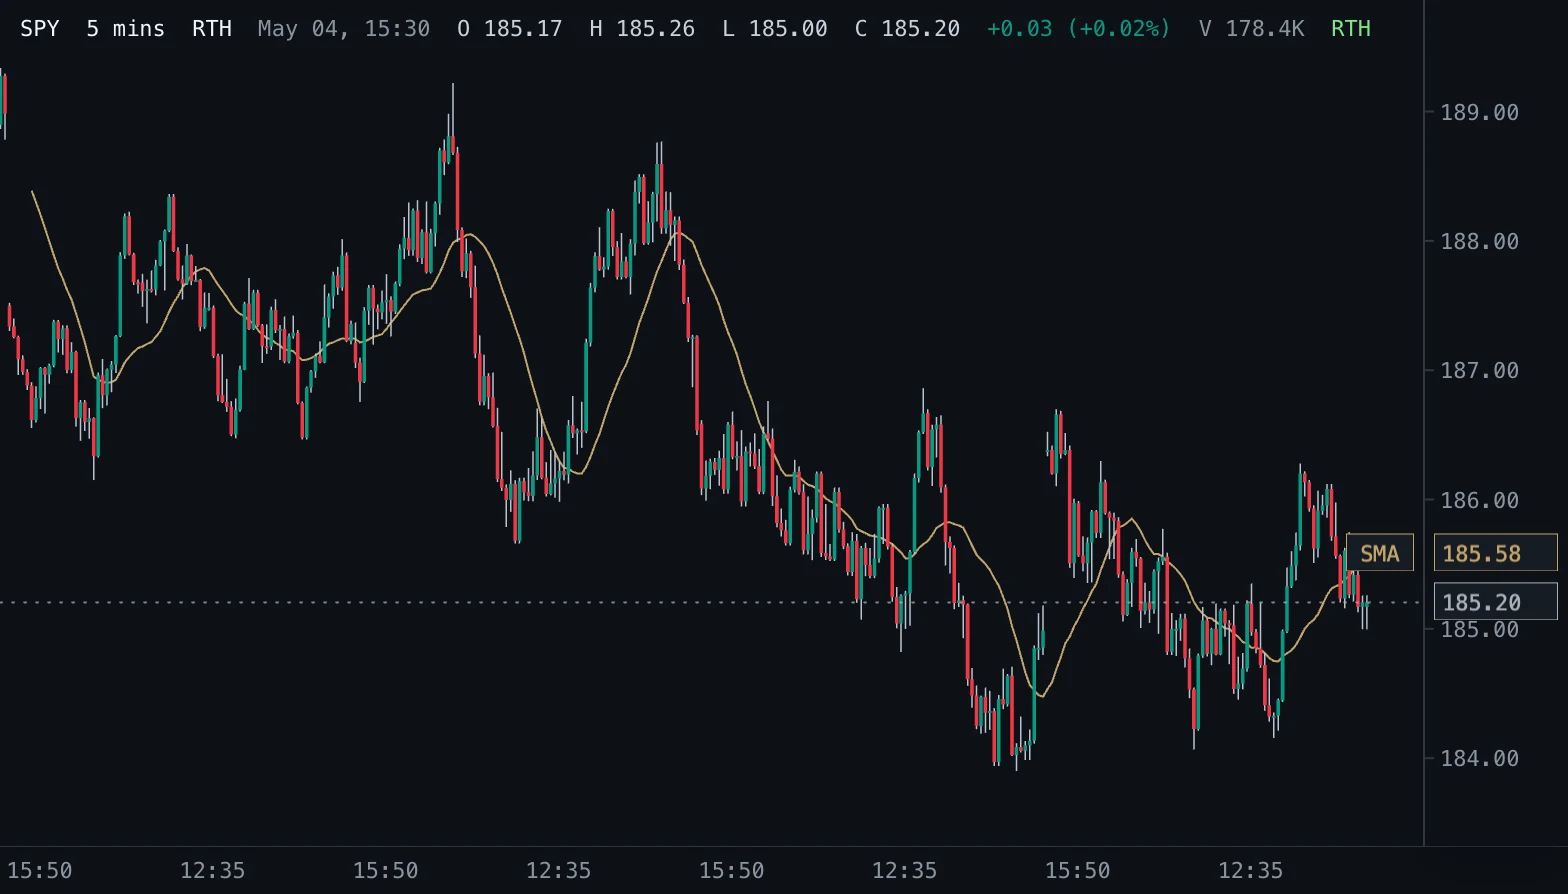
Overview
The simple moving average is the plain average of the selected price over the last Length bars. Every bar in the window counts equally, so the line follows price with a delay of about half the window.
How to read it
A rising average describes positive recent price pressure; a falling average describes negative pressure. Price interactions, slope and agreement with the surrounding market structure tell you more than a single cross of price and average.
Short averages (9, 20) follow intraday swings; long ones (100, 200) describe the larger trend and are watched by many traders as reference levels.
Settings and limitations
Length defaults to 20 bars; the presets add the common 9, 50, 100 and 200. The first value appears after Length bars. A gap in the data restarts the window.
Notes
Computes the same values as the built-in SMA in Spectral. The built-in lists one toolbox entry per length; this file covers them with one indicator and its presets.
Settings
Each setting appears in the indicator's settings panel in Spectral, next to a color setting for every output.
| Setting | Type | Default | Range or options | What it does |
|---|---|---|---|---|
| Length | Whole number | 20 | 1 – 1000 | Number of bars in the average. Longer averages are smoother and react later. |
| Source | Price source | close | open, high, low, close, hlc3 | Price the average is calculated from. |
Presets
Each preset is its own entry in the Indicators toolbox, with these settings changed.
| Toolbox entry | Short name | Settings |
|---|---|---|
| SMA 9 | SMA 9 | Length: 9 |
| SMA 50 | SMA 50 | Length: 50 |
| SMA 100 | SMA 100 | Length: 100 |
| SMA 200 | SMA 200 | Length: 200 |
What it draws
Lines
- SMAsolid · 1 px · primary
#C4A46A
Source
Save it as sma.js and add it with Indicators → Custom indicators → Add file…. The format is explained in the custom indicators guide.
// Copyright (c) 2026 Spectral
// SPDX-License-Identifier: MIT-0
// Free to use, copy, modify and share: https://spectral.trade/docs/custom-indicators/LICENSE.txt
/** @type {import('./spectral-indicator').IndicatorV1} */
export default {
  schemaVersion: 1,
  id: 'sma',
  name: 'Simple Moving Average',
  shortName: 'SMA',
  version: '1.0.0',
  author: 'Spectral',
  description: 'Simple moving average of the chosen price over a fixed number of bars, drawn on the candles.',
  pane: 'price',
  live: { lookback: 0 },
  inputs: {
    length: { type: 'integer', label: 'Length', default: 20, min: 1, max: 1000, description: 'Number of bars in the average. Longer averages are smoother and react later.' },
    source: { type: 'source', label: 'Source', default: 'close', description: 'Price the average is calculated from.' },
  },
  plots: {
    sma: { label: 'SMA', color: '#C4A46A', lineWidth: 1, primary: true },
  },
  presets: [
    { id: 'sma-9', name: 'SMA 9', shortName: 'SMA 9', inputs: { length: 9 } },
    { id: 'sma-50', name: 'SMA 50', shortName: 'SMA 50', inputs: { length: 50 } },
    { id: 'sma-100', name: 'SMA 100', shortName: 'SMA 100', inputs: { length: 100 } },
    { id: 'sma-200', name: 'SMA 200', shortName: 'SMA 200', inputs: { length: 200 } },
  ],
  docs: {
    overview: 'The simple moving average is the plain average of the selected price over the last Length bars. Every bar in the window counts equally, so the line follows price with a delay of about half the window.',
    howToRead: 'A rising average describes positive recent price pressure; a falling average describes negative pressure. Price interactions, slope and agreement with the surrounding market structure tell you more than a single cross of price and average.\n\nShort averages (9, 20) follow intraday swings; long ones (100, 200) describe the larger trend and are watched by many traders as reference levels.',
    settings: 'Length defaults to 20 bars; the presets add the common 9, 50, 100 and 200. The first value appears after Length bars. A gap in the data restarts the window.',
    notes: 'Computes the same values as the built-in SMA in Spectral. The built-in lists one toolbox entry per length; this file covers them with one indicator and its presets.',
  },
  calculate(ctx) {
    const { bars, inputs, ta } = ctx;
    return { plots: { sma: ta.sma(ta.source(bars, inputs.source), inputs.length) } };
  },
};
Adapt it with an LLM
Paste this into your assistant and replace the second-to-last line with the change you want.
Start from this Spectral custom indicator: https://spectral.trade/indicators/sma.js
Format reference: https://spectral.trade/docs/custom-indicators.llm.md
Keep the file format and every rule of the reference; give the result a new id, name, shortName and version, and update docs and input descriptions to match.
Keep its live updates exact and fast (section "Fast live updates" of the reference): carry values from bar to bar only through ctx.ta, and raise live.lookback if the change reads further back; Spectral rejects a file whose live updates differ from a full recalculation or are too slow.
Change I want: <describe the change>
Answer with the complete file in one code block, ready to save as <id>.js.
Related indicators
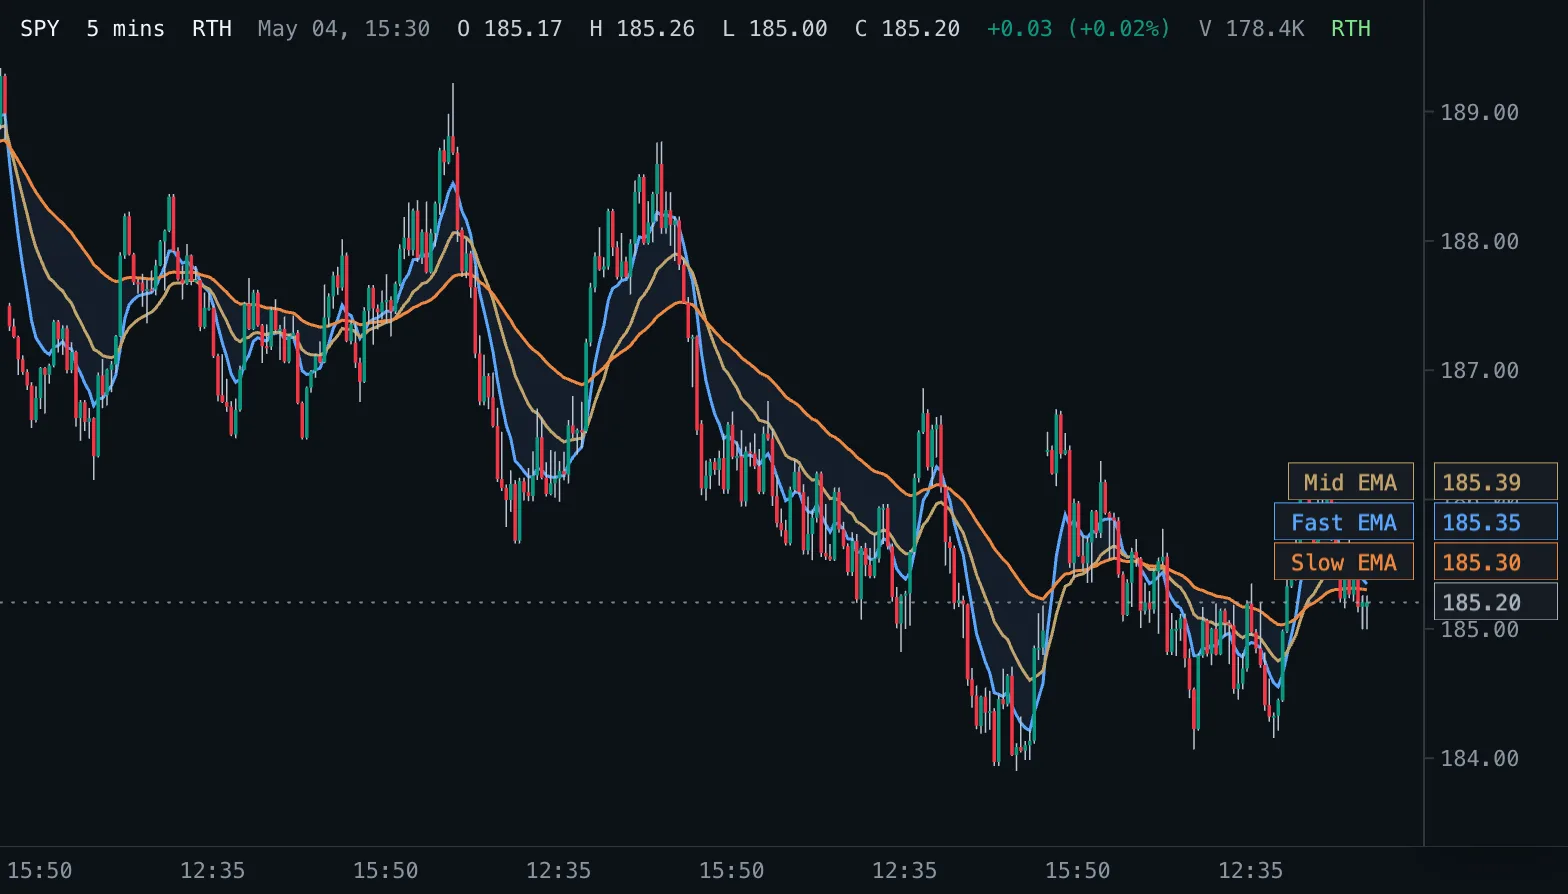
EMA Ribbon Ribbon
Three exponential moving averages on the price pane with a shaded band between the fastest and the slowest.
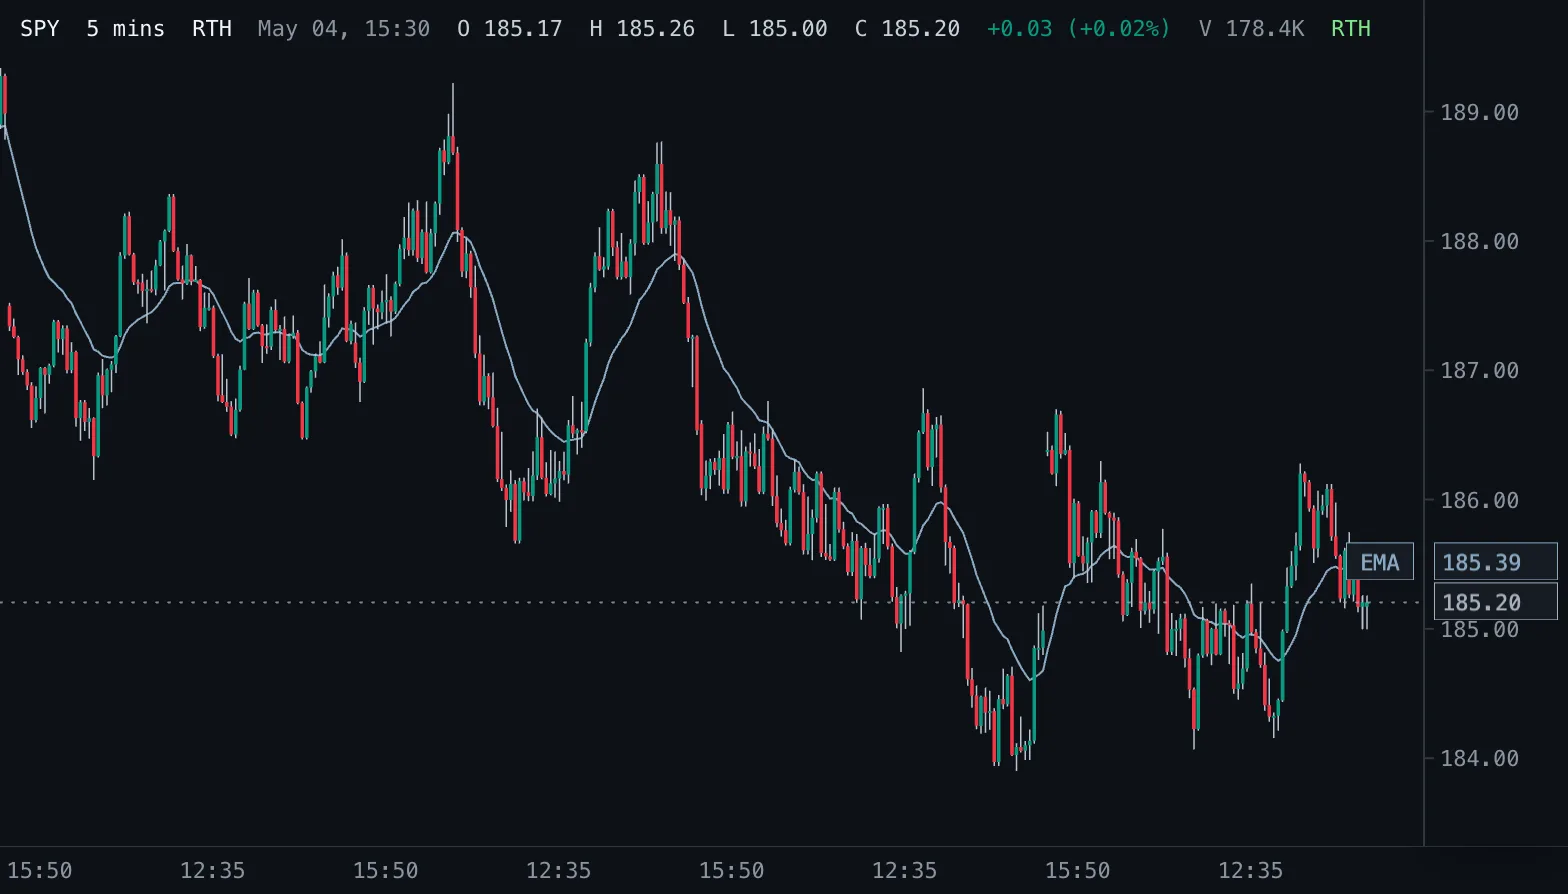
Exponential Moving Average EMA
Exponential moving average of the chosen price, weighting recent bars more, drawn on the candles.
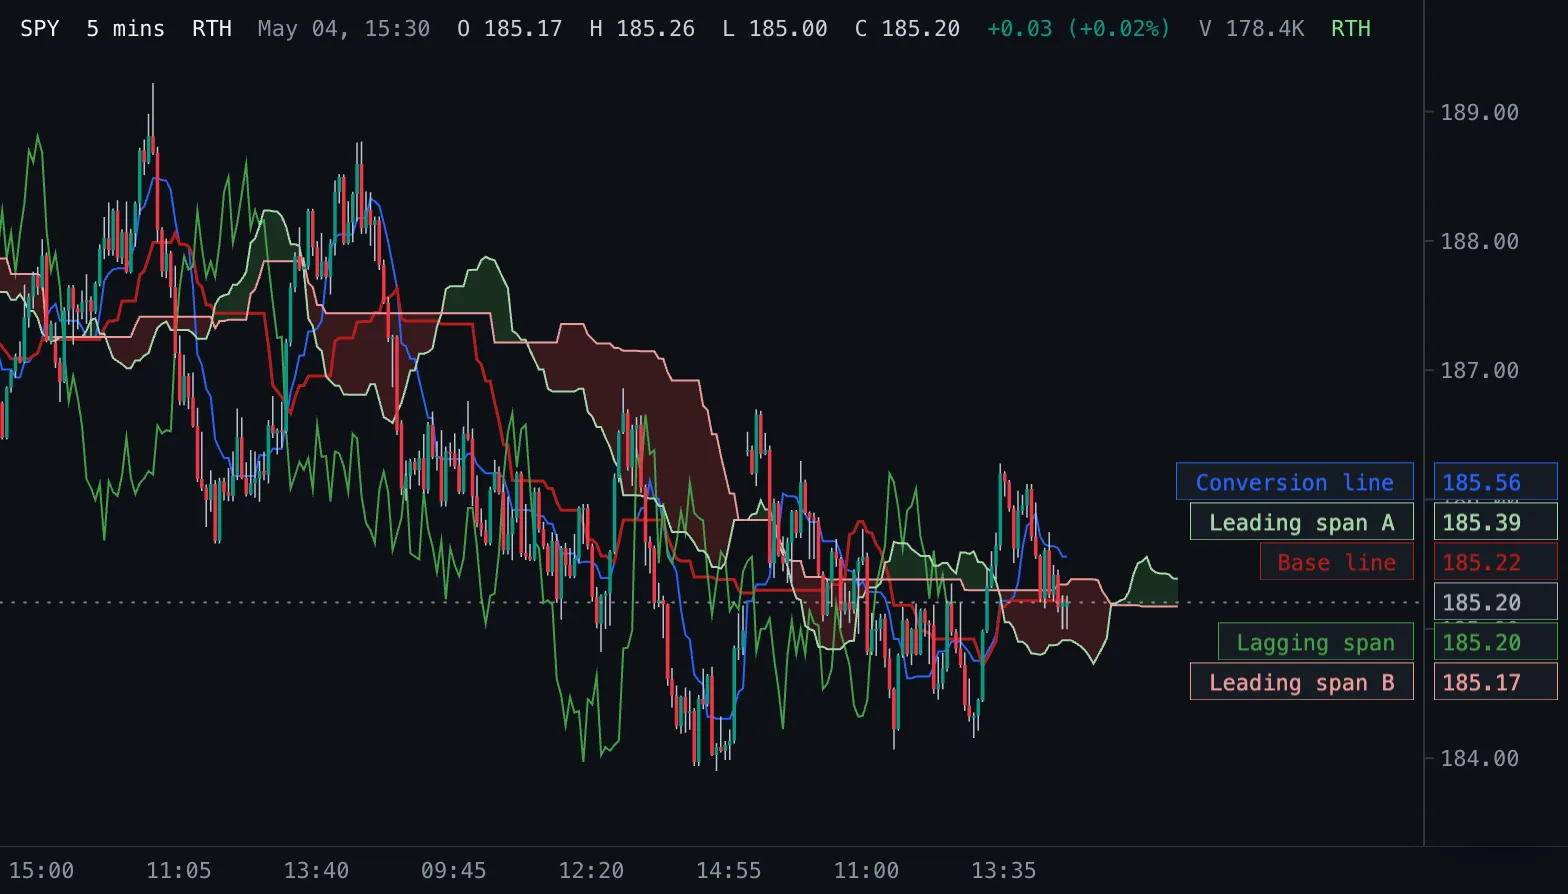
Ichimoku Cloud Ichimoku
Ichimoku Kinko Hyo: conversion and base lines, a cloud of two leading spans projected into the future, and the lagging close.