Trend Regime Table
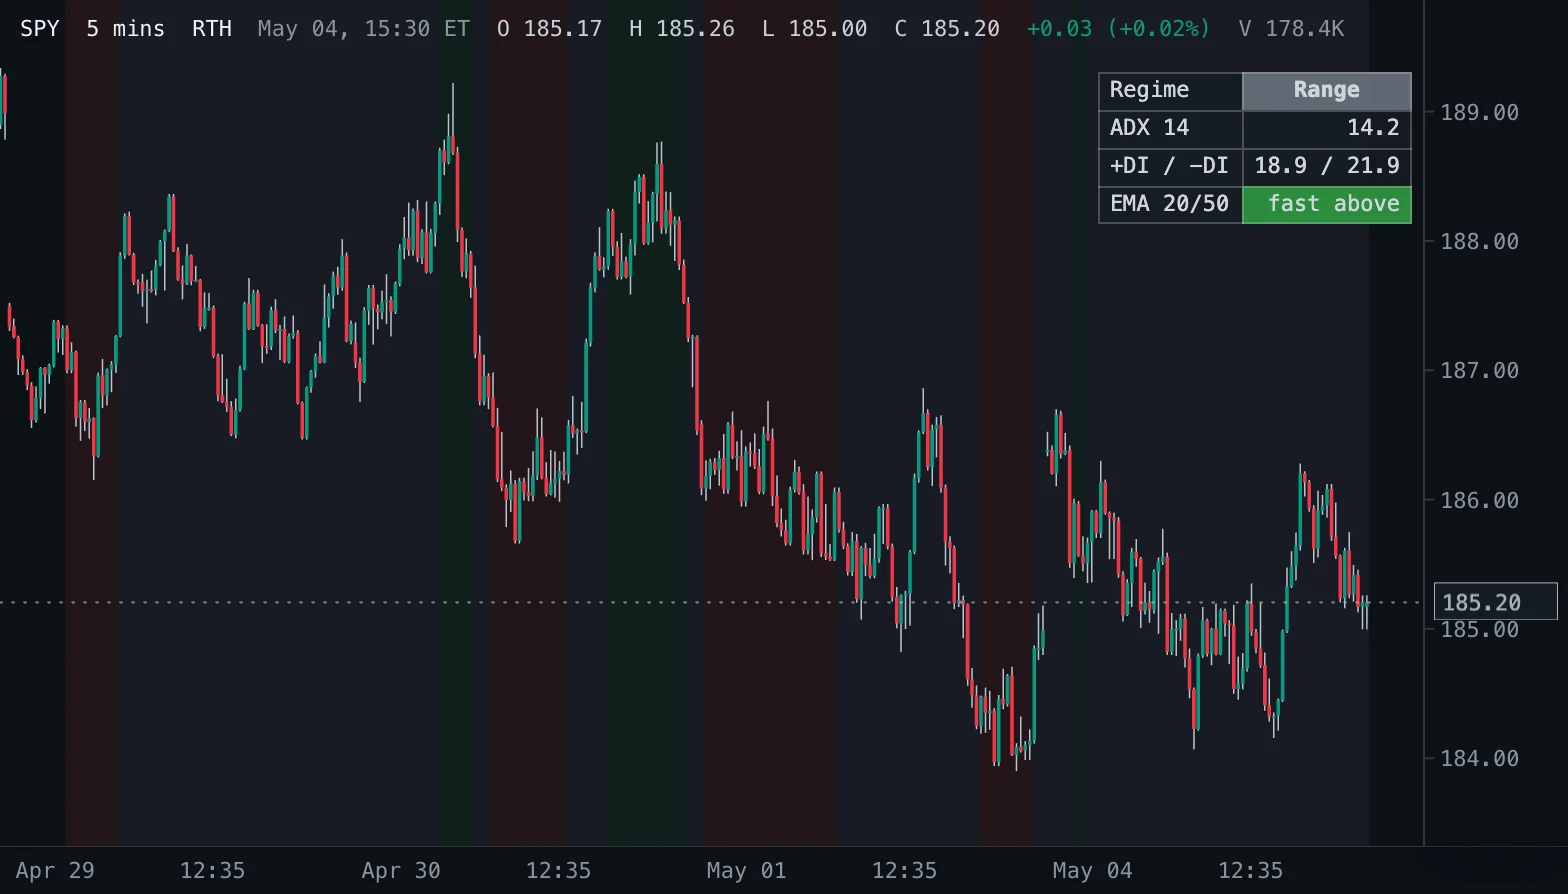
A table on the price pane with ADX, +DI and -DI (Wilder) and the EMA 20/50 state of the latest bar, and the pane shaded by the trend regime of every bar.
- Regime
- Updates every tick
- adx
- dmi
- trend
- regime
- table
- ema
- background
MIT-0: free to use, change and share, no attribution needed. What you build from it is yours.
Overview
Classifies every bar as trending up, trending down or ranging. Trend strength comes from the Average Directional Index and its direction from the directional indicators +DI and -DI (J. Welles Wilder, New Concepts in Technical Trading Systems, 1978); an EMA 20 against an EMA 50 of the close confirms the direction. A table at the top right shows the readings of the latest bar, and the pane background takes the regime colour of every bar.
How to read it
Trend up (green): ADX at or above Trend ADX, +DI above -DI and the fast EMA above the slow one. Trend down (red): ADX at or above Trend ADX, -DI above +DI and the fast EMA below the slow one. Everything else is a range (grey), including a strong ADX whose DI and EMA directions disagree.
A common reading (StockCharts ChartSchool) takes an ADX above 25 as a trending market and below 20 as a weak or absent trend. A rising ADX means the trend is getting stronger in either direction; ADX does not say which way, the DI lines and the EMAs do.
Settings and limitations
DI length sets the Wilder smoothing (14 is Wilder's). Trend ADX is the strength a trend needs. Fast and Slow EMA set the direction filter; a longer pair flips less often and later. The shading opacity, the regime colours and the table position are appearance settings.
Notes
Formulas: +DM is the rise of the high over the prior high when it is larger than the fall of the low and positive, else 0; -DM the mirror image. The true range, +DM and -DM start on the second bar (the first bar has no true range here, unlike ctx.ta.atr, which counts its high minus low) and are smoothed with Wilder's average (the first value is the simple average of the first DI length values, then (previous x (n - 1) + value) / n); +DI and -DI are 100 times the smoothed moves over the smoothed true range, DX is 100 x |+DI - -DI| / (+DI + -DI), and the ADX is DX smoothed the same way, so it appears after about twice DI length bars. Matches the built-in ADX & DMI in Spectral and TradingView's DMI. The EMAs start at the first close. Each bar is read on its own, so the table updates with every tick of the forming bar.
Settings
Each setting appears in the indicator's settings panel in Spectral, next to a color setting for every output.
| Setting | Type | Default | Range or options | What it does |
|---|---|---|---|---|
| DI length | Whole number | 14 | 2 – 100 | Bars in the Wilder smoothing of the true range, the directional movement and the ADX. |
| Trend ADX | Number | 25 | 10 – 50, step 0.5 | ADX at or above this value counts as a trend (25 is the common reading, e.g. StockCharts). |
| Fast EMA | Whole number | 20 | 2 – 200 | Bars in the fast EMA of the close. |
| Slow EMA | Whole number | 50 | 3 – 400 | Bars in the slow EMA of the close. |
What it draws
Tables
- Trend regime2 columns · top right · cell borders
#161B22
Background shadings
- Regime shadingbackground per bar from Regime (3 colors) · at 10% opacity
#2EA043 #DA3633 #6E7681
Source
Save it as trend-regime-table.js and add it with Indicators → Custom indicators → Add file…. The format is explained in the custom indicators guide.
// Copyright (c) 2026 Spectral
// SPDX-License-Identifier: MIT-0
// Free to use, copy, modify and share: https://spectral.trade/docs/custom-indicators/LICENSE.txt
/** @type {import('./spectral-indicator').IndicatorV3} */
export default {
  schemaVersion: 3,
  id: 'trend-regime-table',
  name: 'Trend Regime Table',
  shortName: 'Regime',
  version: '1.0.0',
  author: 'Spectral',
  description: 'A table on the price pane with ADX, +DI and -DI (Wilder) and the EMA 20/50 state of the latest bar, and the pane shaded by the trend regime of every bar.',
  pane: 'price',
  live: { lookback: 1 },
  inputs: {
    length: { type: 'integer', label: 'DI length', default: 14, min: 2, max: 100, description: 'Bars in the Wilder smoothing of the true range, the directional movement and the ADX.' },
    threshold: { type: 'number', label: 'Trend ADX', default: 25, min: 10, max: 50, step: 0.5, description: 'ADX at or above this value counts as a trend (25 is the common reading, e.g. StockCharts).' },
    fast: { type: 'integer', label: 'Fast EMA', default: 20, min: 2, max: 200, description: 'Bars in the fast EMA of the close.' },
    slow: { type: 'integer', label: 'Slow EMA', default: 50, min: 3, max: 400, description: 'Bars in the slow EMA of the close.' },
  },
  palettes: {
    regime: { label: 'Regime', colors: ['#2EA043', '#DA3633', '#6E7681'] },
  },
  tables: {
    regime: { label: 'Trend regime', position: 'top-right', columns: [{ align: 'left' }, { align: 'right', width: 11 }], border: true },
  },
  bgColors: {
    shading: { label: 'Regime shading', palette: 'regime', opacity: 0.1 },
  },
  docs: {
    overview: 'Classifies every bar as trending up, trending down or ranging. Trend strength comes from the Average Directional Index and its direction from the directional indicators +DI and -DI (J. Welles Wilder, New Concepts in Technical Trading Systems, 1978); an EMA 20 against an EMA 50 of the close confirms the direction. A table at the top right shows the readings of the latest bar, and the pane background takes the regime colour of every bar.',
    howToRead: 'Trend up (green): ADX at or above Trend ADX, +DI above -DI and the fast EMA above the slow one. Trend down (red): ADX at or above Trend ADX, -DI above +DI and the fast EMA below the slow one. Everything else is a range (grey), including a strong ADX whose DI and EMA directions disagree.\n\nA common reading (StockCharts ChartSchool) takes an ADX above 25 as a trending market and below 20 as a weak or absent trend. A rising ADX means the trend is getting stronger in either direction; ADX does not say which way, the DI lines and the EMAs do.',
    settings: 'DI length sets the Wilder smoothing (14 is Wilder\'s). Trend ADX is the strength a trend needs. Fast and Slow EMA set the direction filter; a longer pair flips less often and later. The shading opacity, the regime colours and the table position are appearance settings.',
    notes: 'Formulas: +DM is the rise of the high over the prior high when it is larger than the fall of the low and positive, else 0; -DM the mirror image. The true range, +DM and -DM start on the second bar (the first bar has no true range here, unlike ctx.ta.atr, which counts its high minus low) and are smoothed with Wilder\'s average (the first value is the simple average of the first DI length values, then (previous x (n - 1) + value) / n); +DI and -DI are 100 times the smoothed moves over the smoothed true range, DX is 100 x |+DI - -DI| / (+DI + -DI), and the ADX is DX smoothed the same way, so it appears after about twice DI length bars. Matches the built-in ADX & DMI in Spectral and TradingView\'s DMI. The EMAs start at the first close. Each bar is read on its own, so the table updates with every tick of the forming bar.',
  },
  calculate(ctx) {
    const { bars, inputs, ta, format } = ctx;
    const count = bars.length;
    const plusMove = new Array(count).fill(null);
    const minusMove = new Array(count).fill(null);
    const trueRange = new Array(count).fill(null);
    for (let index = 1; index < count; index += 1) {
      const bar = bars[index];
      const previous = bars[index - 1];
      const up = bar.high - previous.high;
      const down = previous.low - bar.low;
      plusMove[index] = up > down && up > 0 ? up : 0;
      minusMove[index] = down > up && down > 0 ? down : 0;
      trueRange[index] = Math.max(bar.high - bar.low, Math.abs(bar.high - previous.close), Math.abs(bar.low - previous.close));
    }
    const range = ta.rma(trueRange, inputs.length);
    const plusSmooth = ta.rma(plusMove, inputs.length);
    const minusSmooth = ta.rma(minusMove, inputs.length);
    const plusDi = new Array(count).fill(null);
    const minusDi = new Array(count).fill(null);
    const dx = new Array(count).fill(null);
    for (let index = 0; index < count; index += 1) {
      const total = range[index];
      if (total === null || plusSmooth[index] === null || minusSmooth[index] === null || !(total > 0)) continue;
      plusDi[index] = (100 * plusSmooth[index]) / total;
      minusDi[index] = (100 * minusSmooth[index]) / total;
      const sum = plusDi[index] + minusDi[index];
      dx[index] = sum === 0 ? 0 : (100 * Math.abs(plusDi[index] - minusDi[index])) / sum;
    }
    const adx = ta.rma(dx, inputs.length);
    const close = ta.source(bars, 'close');
    const fast = ta.ema(close, inputs.fast);
    const slow = ta.ema(close, inputs.slow);

    // Palette indexes: 0 trend up, 1 trend down, 2 range; null until the ADX exists.
    const regime = adx.map((strength, index) => {
      if (strength === null || plusDi[index] === null || fast[index] === null || slow[index] === null) return null;
      if (strength >= inputs.threshold) {
        if (plusDi[index] > minusDi[index] && fast[index] > slow[index]) return 0;
        if (minusDi[index] > plusDi[index] && fast[index] < slow[index]) return 1;
      }
      return 2;
    });

    const last = count - 1;
    if (last < 0) return { tables: { regime: null }, bgColors: { shading: regime } };
    const verdict = regime[last];
    const emaState = fast[last] === null || slow[last] === null ? { text: 'n/a' }
      : fast[last] > slow[last] ? { text: 'fast above', palette: 0 }
        : fast[last] < slow[last] ? { text: 'fast below', palette: 1 } : { text: 'equal', palette: 2 };
    return {
      tables: {
        regime: {
          palette: 'regime',
          rows: [
            ['Regime', verdict === null ? 'n/a' : { text: ['Trend up', 'Trend down', 'Range'][verdict], palette: verdict, weight: 'bold', align: 'center' }],
            [`ADX ${inputs.length}`, plusDi[last] === null ? 'n/a' : format.number(adx[last], 1)],
            ['+DI / -DI', `${format.number(plusDi[last], 1)} / ${format.number(minusDi[last], 1)}`],
            [`EMA ${inputs.fast}/${inputs.slow}`, emaState],
          ],
        },
      },
      bgColors: { shading: regime },
    };
  },
};
Adapt it with an LLM
Paste this into your assistant and replace the second-to-last line with the change you want.
Start from this Spectral custom indicator: https://spectral.trade/indicators/trend-regime-table.js
Format reference: https://spectral.trade/docs/custom-indicators.llm.md
Keep the file format and every rule of the reference; give the result a new id, name, shortName and version, and update docs and input descriptions to match.
Keep its live updates exact and fast (section "Fast live updates" of the reference): carry values from bar to bar only through ctx.ta, and raise live.lookback if the change reads further back; Spectral rejects a file whose live updates differ from a full recalculation or are too slow.
Change I want: <describe the change>
Answer with the complete file in one code block, ready to save as <id>.js.
Related indicators
EMA Ribbon Ribbon
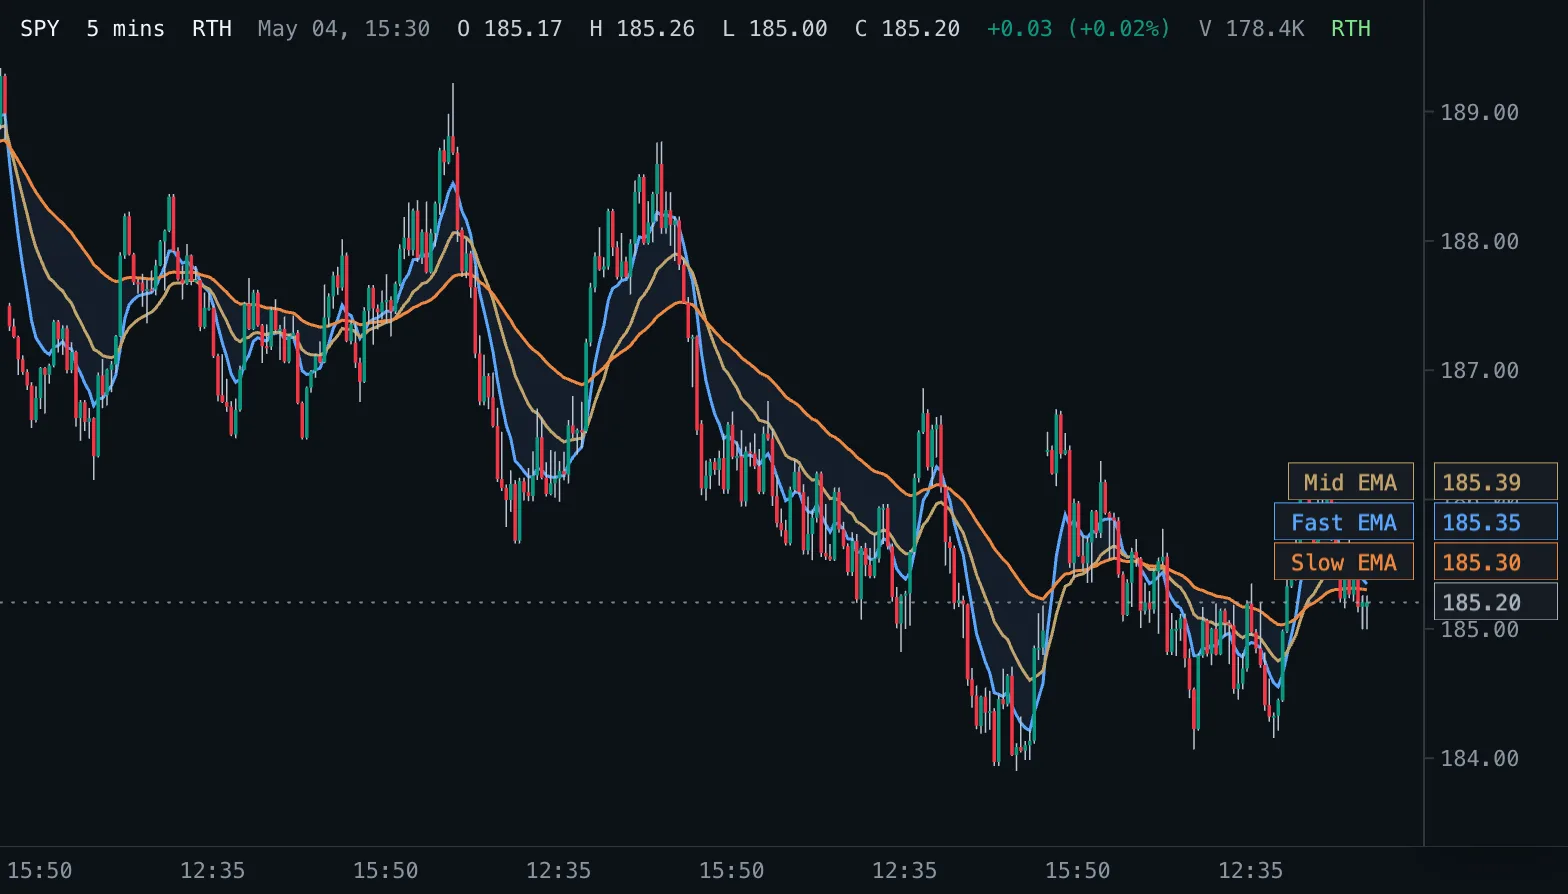
Three exponential moving averages on the price pane with a shaded band between the fastest and the slowest.
Exponential Moving Average EMA
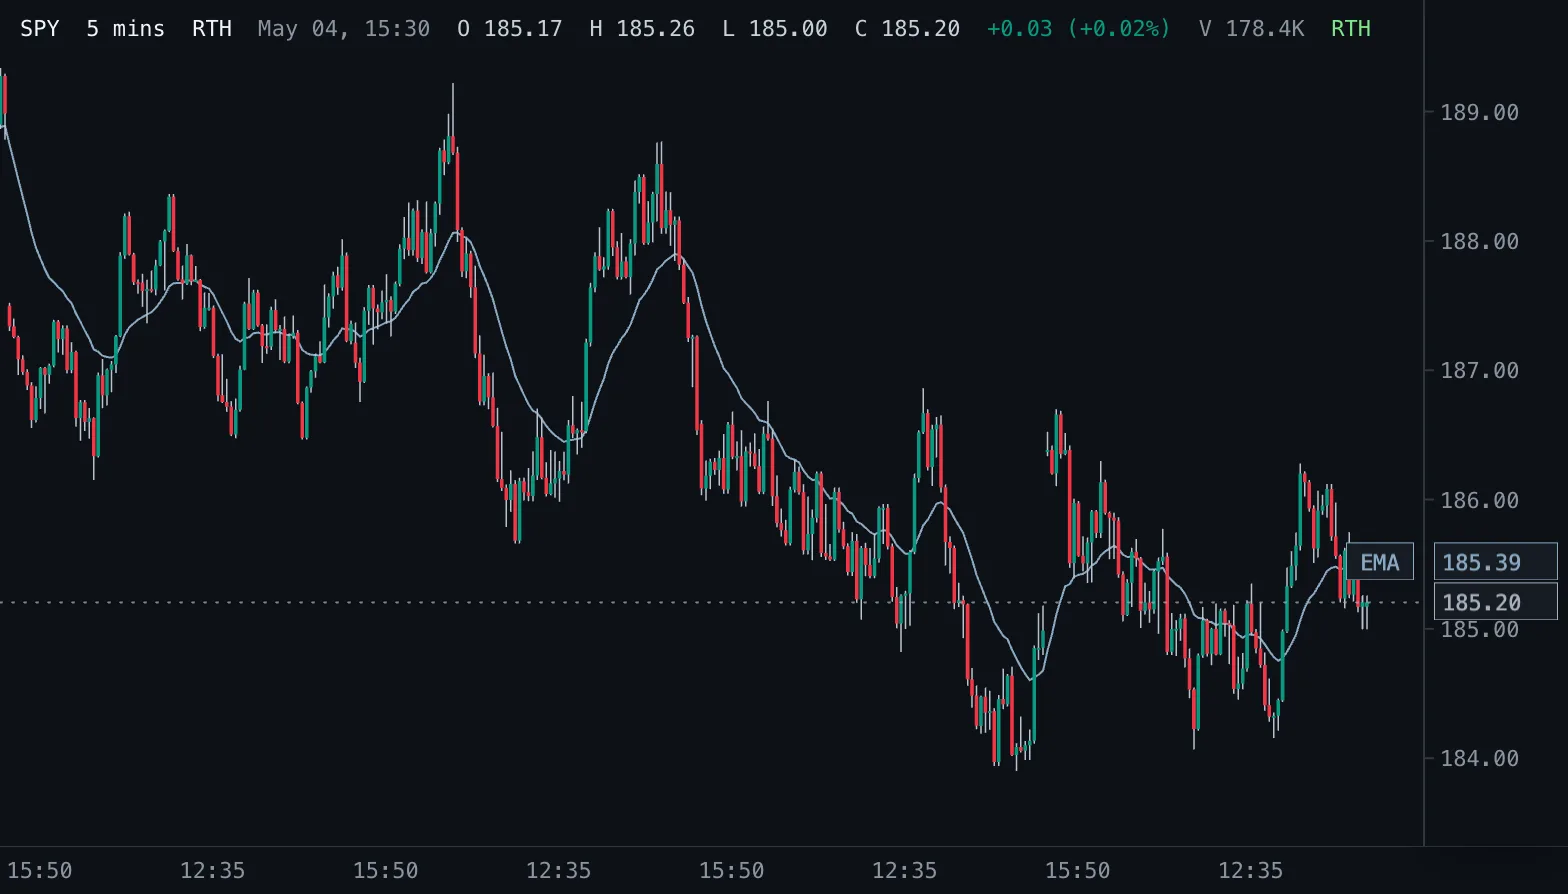
Exponential moving average of the chosen price, weighting recent bars more, drawn on the candles.
Ichimoku Cloud Ichimoku
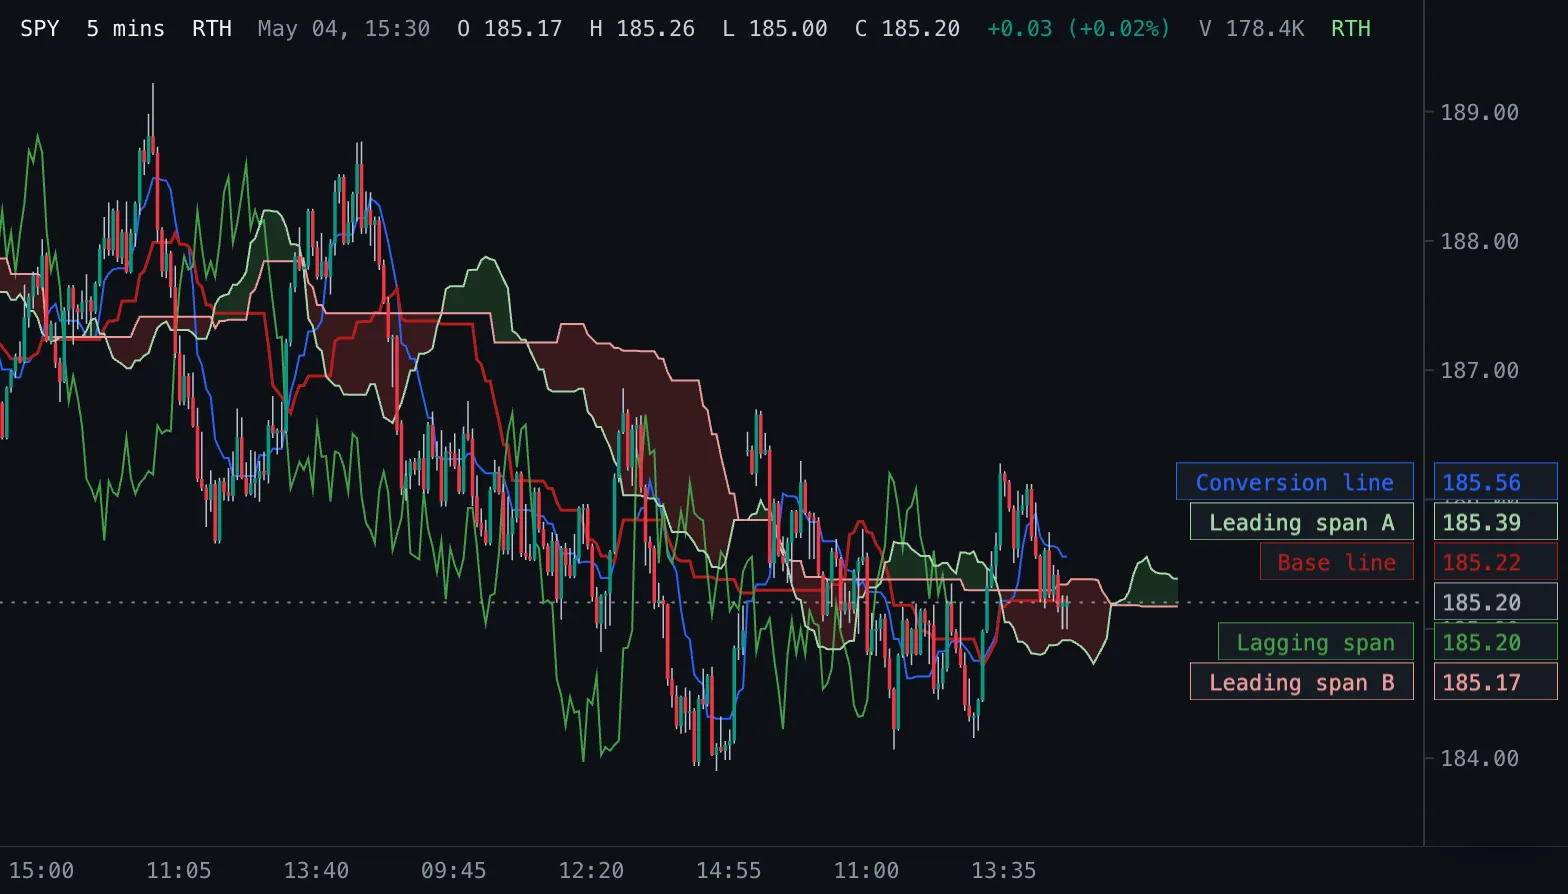
Ichimoku Kinko Hyo: conversion and base lines, a cloud of two leading spans projected into the future, and the lagging close.