True Strength Index
Double-smoothed price change divided by double-smoothed absolute price change, from -100 to 100, with a signal line.
- TSI
- Built into Spectral
- Updates every tick
- tsi
- true strength index
- double smoothed
- signal line
- momentum
- oscillator
MIT-0: free to use, change and share, no attribution needed. What you build from it is yours.
Already in Spectral: add it from the Indicators toolbox. The file here is the same indicator written as a custom indicator, to change or learn from. Installed, it appears next to the built-in one, marked Custom.
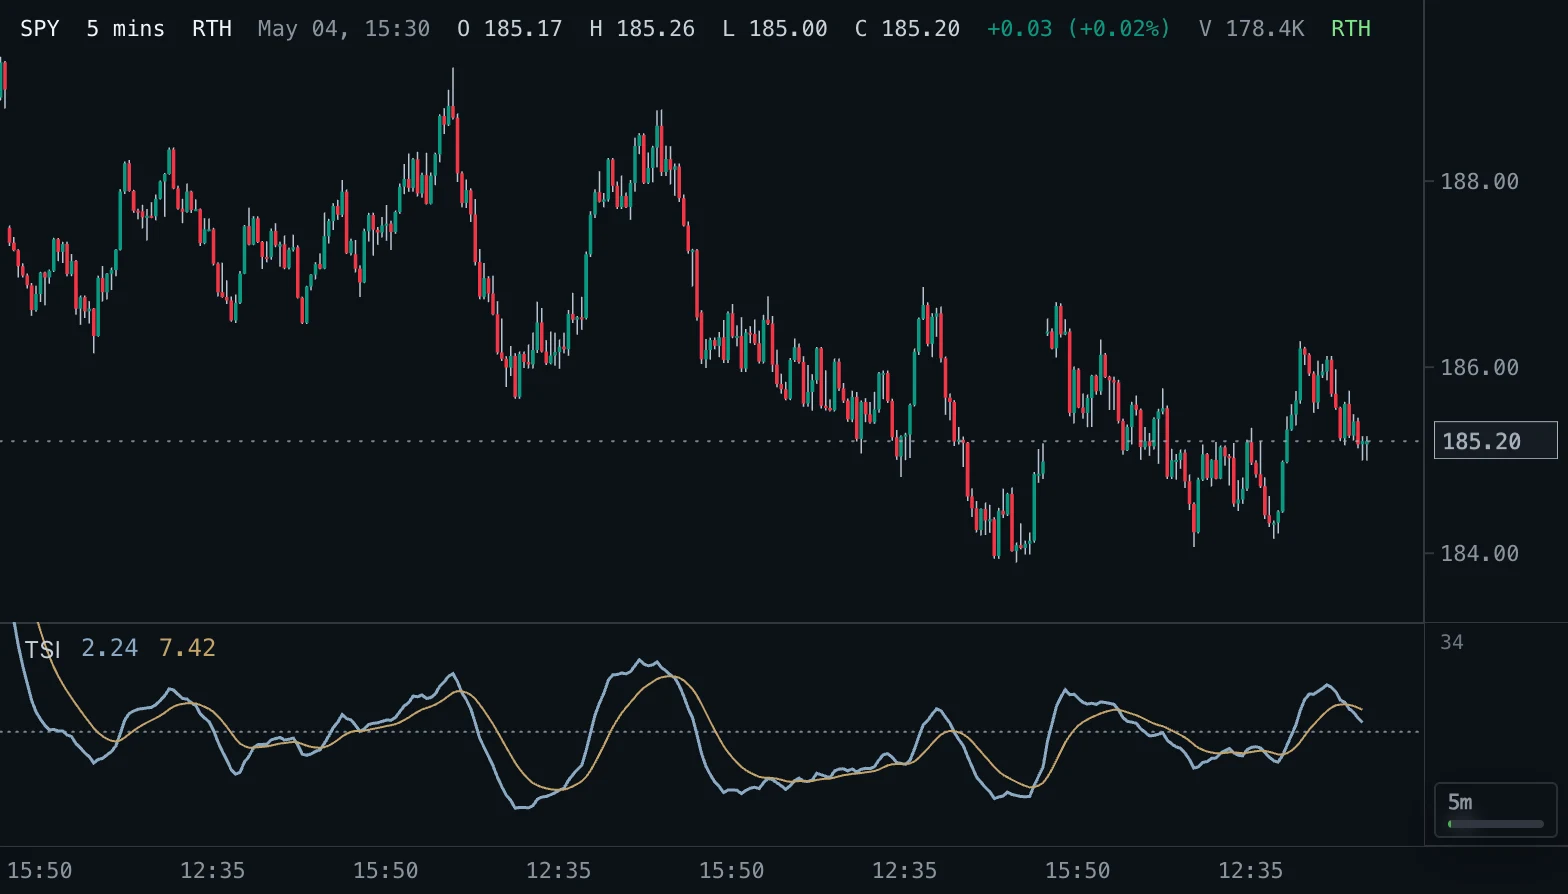
Overview
The True Strength Index (William Blau) smooths the one-bar price change twice with exponential averages (first Long length, then Short length) and divides it by the same double smoothing of the absolute change. The result, times 100, runs from -100 (every bar down) to 100 (every bar up). The signal line is an exponential average of TSI.
How to read it
Above zero up moves have outweighed down moves, below zero the reverse; the distance from zero shows how one-sided the market has been. TSI crossing its signal line shows a shift in momentum, and the zero cross a shift in the trend's direction.
Readings beyond about +25 or -25 are strong for most instruments, but the useful extremes depend on the instrument and bar size, so compare with its own history. Divergences against price are worth noting.
Settings and limitations
Defaults are 25, 13 and a 13-bar signal, as on TradingView. A shorter pair such as 13 and 7 reacts faster. The averages start at the second bar, so the earliest values settle after a few times Long length bars. A price that has not moved since the history began has no value.
Notes
Matches the True Strength Index on TradingView and most platforms.
Settings
Each setting appears in the indicator's settings panel in Spectral, next to a color setting for every output.
| Setting | Type | Default | Range or options | What it does |
|---|---|---|---|---|
| Long length | Whole number | 25 | 1 – 500 | Bars in the first exponential smoothing of the price change. |
| Short length | Whole number | 13 | 1 – 500 | Bars in the second exponential smoothing. |
| Signal length | Whole number | 13 | 1 – 500 | Bars in the exponential average of TSI that forms the signal line. |
| Source | Price source | close | open, high, low, close, hlc3 | Price the change is calculated from. |
Presets
Each preset is its own entry in the Indicators toolbox, with these settings changed.
| Toolbox entry | Short name | Settings |
|---|---|---|
| True Strength Index (13, 7, 7) | TSI 13 7 | Long length: 13Short length: 7Signal length: 7 |
What it draws
Lines
- TSIsolid · 1.5 px · primary
#8AA9C3 - Signalsolid · 1 px
#C4A46A
Levels
- Zero linedotted · 1 px
#788493
Source
Save it as tsi.js and add it with Indicators → Custom indicators → Add file…. The format is explained in the custom indicators guide.
// Copyright (c) 2026 Spectral
// SPDX-License-Identifier: MIT-0
// Free to use, copy, modify and share: https://spectral.trade/docs/custom-indicators/LICENSE.txt
/** @type {import('./spectral-indicator').IndicatorV2} */
export default {
  schemaVersion: 2,
  id: 'tsi',
  name: 'True Strength Index',
  shortName: 'TSI',
  version: '1.0.0',
  author: 'Spectral',
  description: 'Double-smoothed price change divided by double-smoothed absolute price change, from -100 to 100, with a signal line.',
  pane: 'oscillator',
  live: { lookback: 1 },
  inputs: {
    longLength: { type: 'integer', label: 'Long length', default: 25, min: 1, max: 500, description: 'Bars in the first exponential smoothing of the price change.' },
    shortLength: { type: 'integer', label: 'Short length', default: 13, min: 1, max: 500, description: 'Bars in the second exponential smoothing.' },
    signalLength: { type: 'integer', label: 'Signal length', default: 13, min: 1, max: 500, description: 'Bars in the exponential average of TSI that forms the signal line.' },
    source: { type: 'source', label: 'Source', default: 'close', description: 'Price the change is calculated from.' },
  },
  plots: {
    tsi: { label: 'TSI', color: '#8AA9C3', lineWidth: 1.5, primary: true },
    signal: { label: 'Signal', color: '#C4A46A', lineWidth: 1 },
  },
  levels: {
    zero: { label: 'Zero line', color: '#788493', lineStyle: 'dotted' },
  },
  presets: [
    { id: 'short-term', name: 'True Strength Index (13, 7, 7)', shortName: 'TSI 13 7', inputs: { longLength: 13, shortLength: 7, signalLength: 7 } },
  ],
  docs: {
    overview: 'The True Strength Index (William Blau) smooths the one-bar price change twice with exponential averages (first Long length, then Short length) and divides it by the same double smoothing of the absolute change. The result, times 100, runs from -100 (every bar down) to 100 (every bar up). The signal line is an exponential average of TSI.',
    howToRead: 'Above zero up moves have outweighed down moves, below zero the reverse; the distance from zero shows how one-sided the market has been. TSI crossing its signal line shows a shift in momentum, and the zero cross a shift in the trend\'s direction.\n\nReadings beyond about +25 or -25 are strong for most instruments, but the useful extremes depend on the instrument and bar size, so compare with its own history. Divergences against price are worth noting.',
    settings: 'Defaults are 25, 13 and a 13-bar signal, as on TradingView. A shorter pair such as 13 and 7 reacts faster. The averages start at the second bar, so the earliest values settle after a few times Long length bars. A price that has not moved since the history began has no value.',
    notes: 'Matches the True Strength Index on TradingView and most platforms.',
  },
  calculate(ctx) {
    const { bars, inputs, ta } = ctx;
    const change = ta.change(ta.source(bars, inputs.source), 1);
    const doubleSmooth = (values) => ta.ema(ta.ema(values, inputs.longLength), inputs.shortLength);
    const smoothed = doubleSmooth(change);
    const absolute = doubleSmooth(change.map((value) => (value === null ? null : Math.abs(value))));
    const tsi = smoothed.map((value, index) => (value === null || !absolute[index] ? null : (100 * value) / absolute[index]));
    return { plots: { tsi, signal: ta.ema(tsi, inputs.signalLength) }, levels: { zero: 0 } };
  },
};
Adapt it with an LLM
Paste this into your assistant and replace the second-to-last line with the change you want.
Start from this Spectral custom indicator: https://spectral.trade/indicators/tsi.js
Format reference: https://spectral.trade/docs/custom-indicators.llm.md
Keep the file format and every rule of the reference; give the result a new id, name, shortName and version, and update docs and input descriptions to match.
Keep its live updates exact and fast (section "Fast live updates" of the reference): carry values from bar to bar only through ctx.ta, and raise live.lookback if the change reads further back; Spectral rejects a file whose live updates differ from a full recalculation or are too slow.
Change I want: <describe the change>
Answer with the complete file in one code block, ready to save as <id>.js.
Related indicators
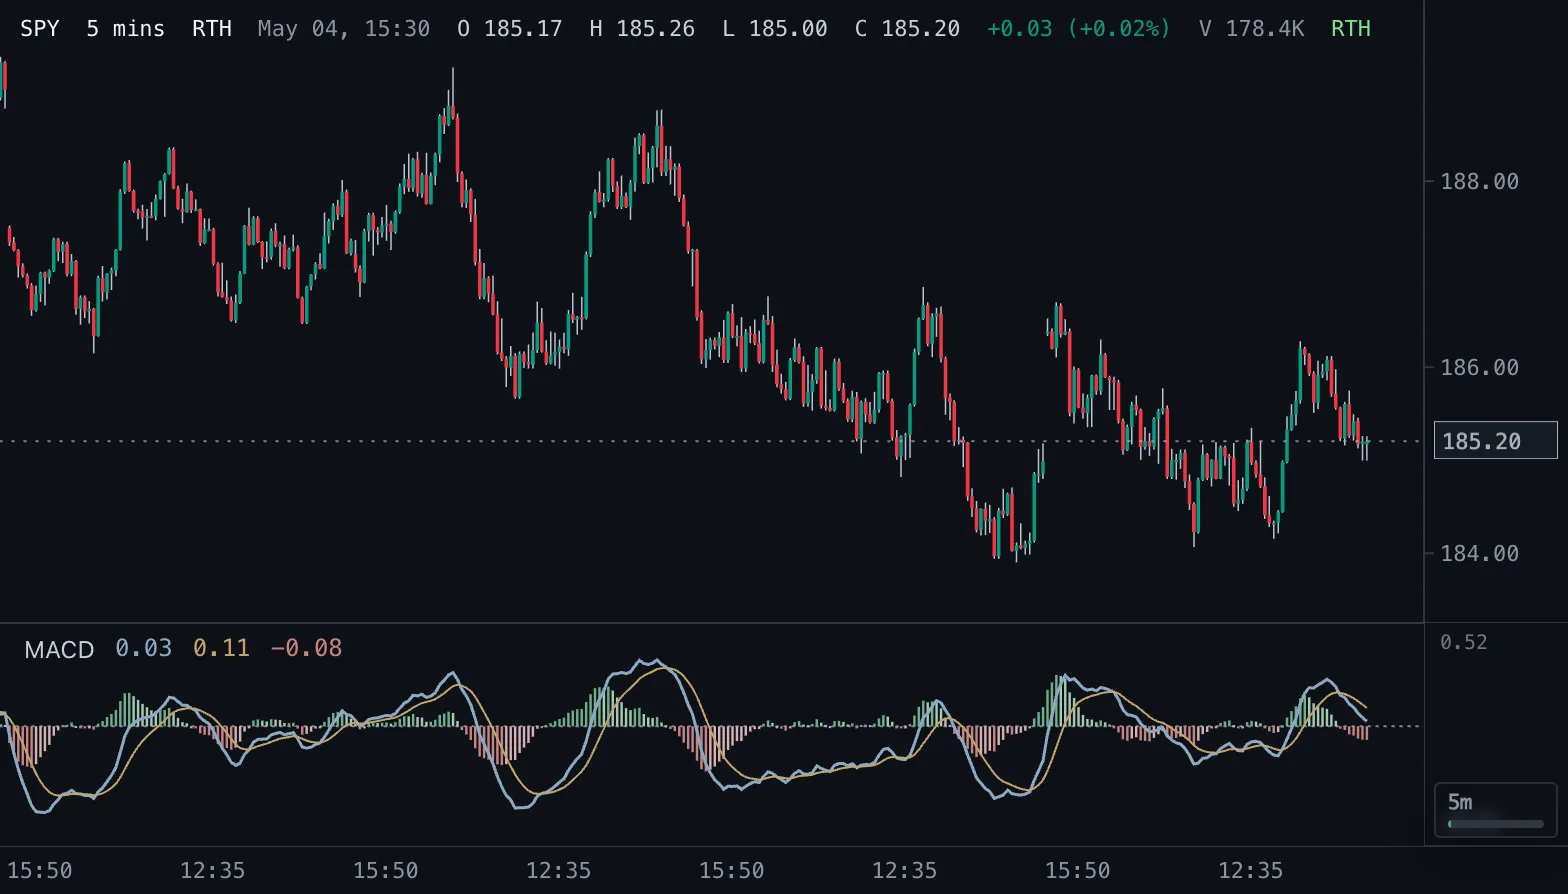
Moving Average Convergence Divergence MACD
MACD line, signal line and a four-color histogram that shows whether momentum is rising or falling.
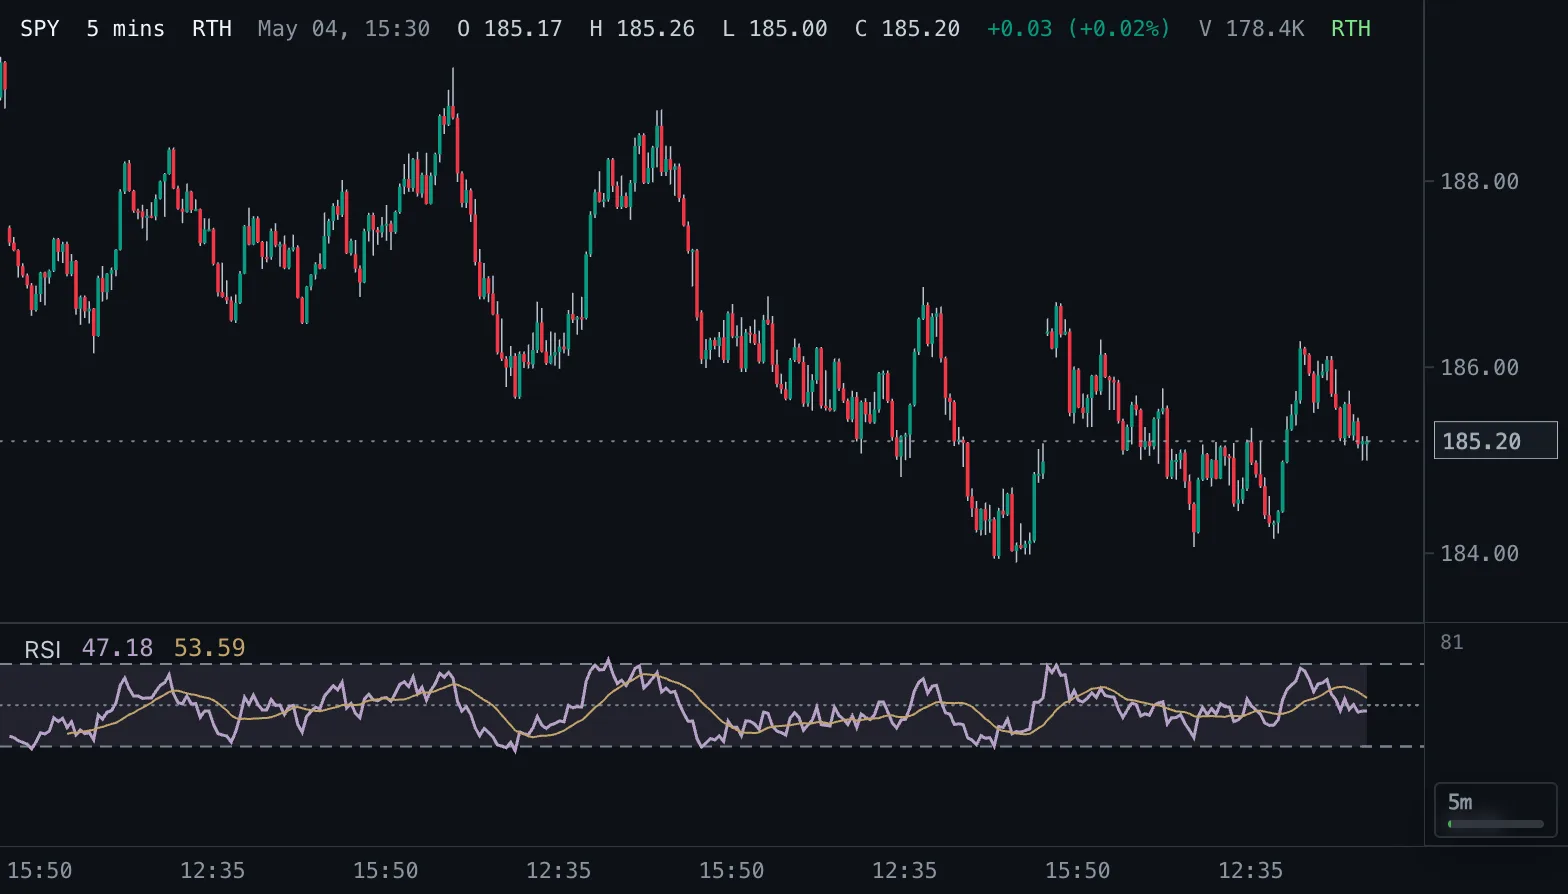
Relative Strength Index RSI
Wilder RSI on a 0-100 scale with a smoothing average and 30/50/70 reference bands.
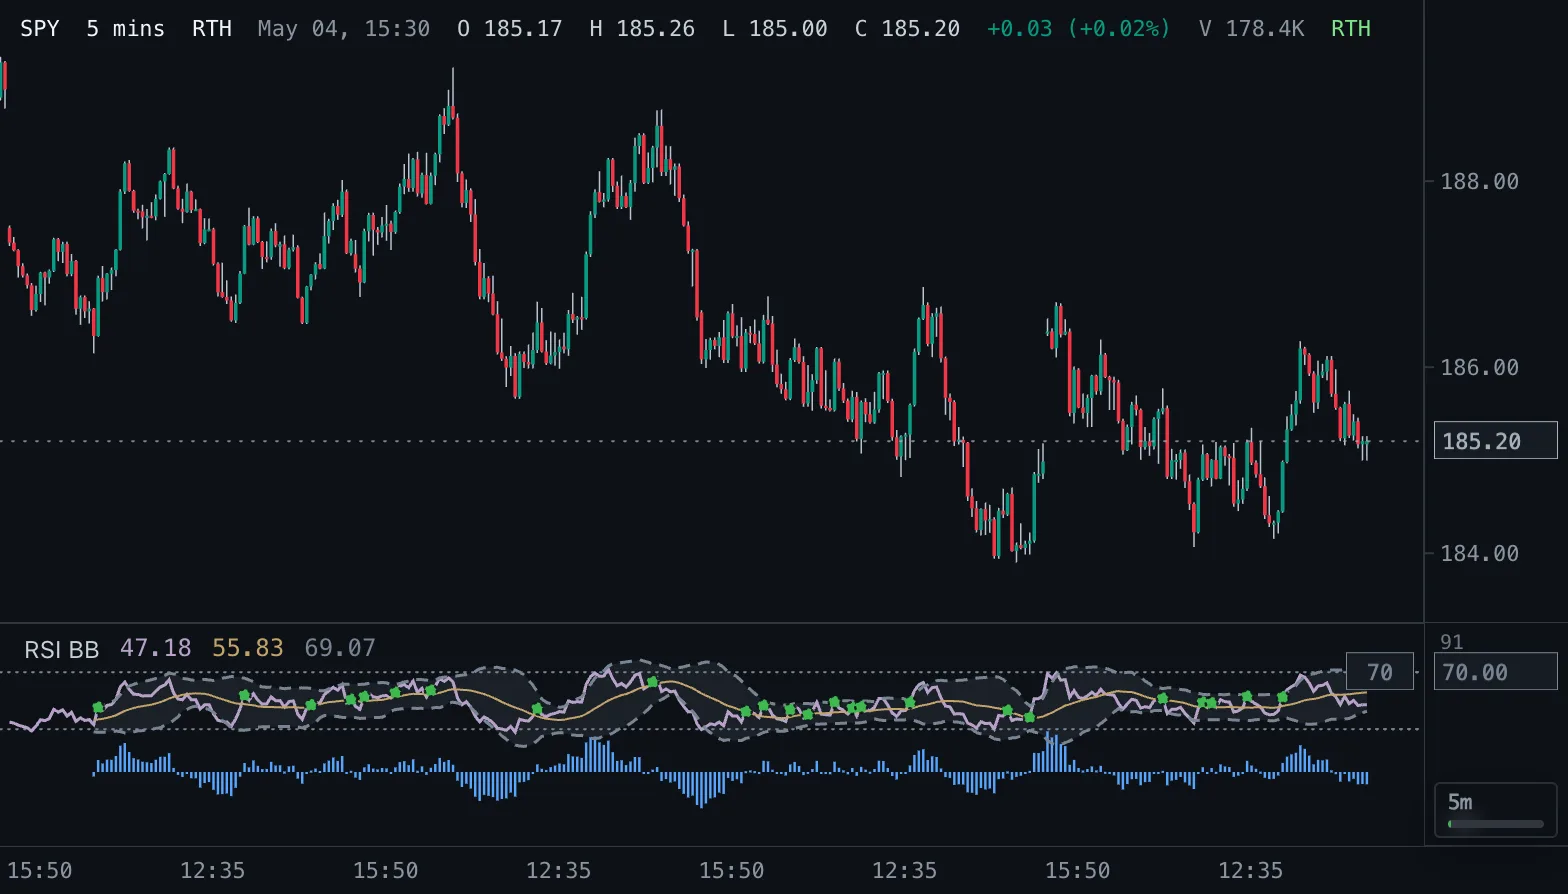
RSI with Bollinger Bands RSI BB
RSI with a Bollinger envelope around its moving average, 30/70 guides and crossover dots.