Relative Volume
Volume as a multiple of normal: against the average of the prior bars, or against the same time of day on earlier sessions.
- RVOL
- Built into Spectral
- Updates every tick
- Uses volume
- relative volume
- rvol
- rvol at time
- volume spike
- time of day
- participation
Updates every tick with the default settings; with "Compare with" set to Time of day or Time of day (cumulative), it updates at bar close.
MIT-0: free to use, change and share, no attribution needed. What you build from it is yours.
Already in Spectral: add it from the Indicators toolbox. The file here is the same indicator written as a custom indicator, to change or learn from. Installed, it appears next to the built-in one, marked Custom.
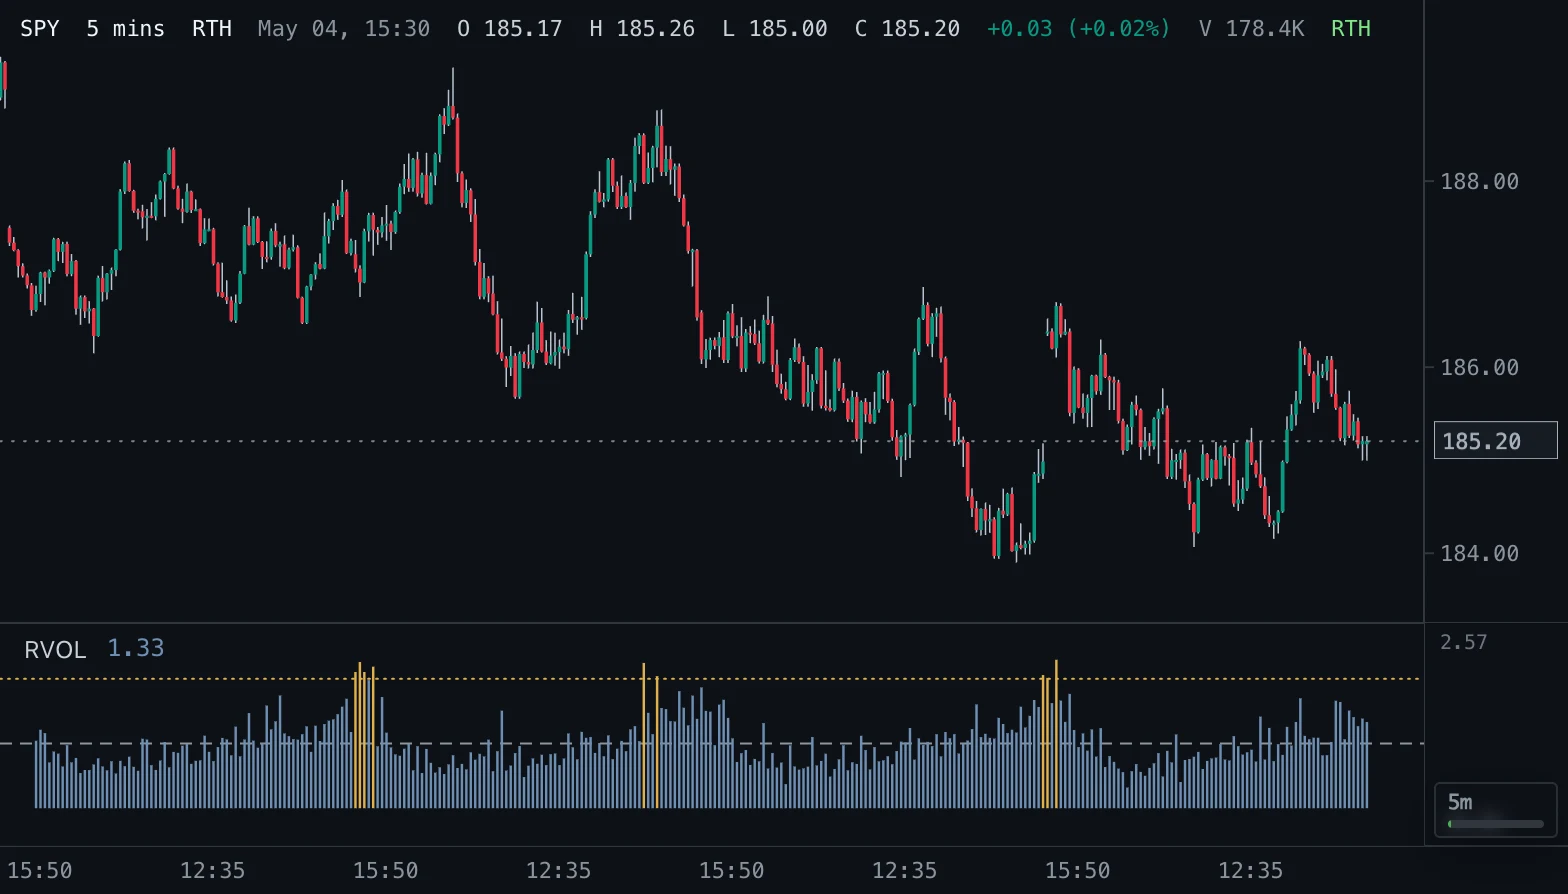
Overview
Relative Volume (RVOL) shows how unusual the current volume is: 1 means normal, 2 means twice the usual volume, 0.5 half of it. The bars turn gold at or above the High RVOL multiple.
Compared with prior bars, each bar is measured against the average of the bars right before it. Compared with the time of day, each bar is measured against the same time on earlier sessions, which removes the normal intraday pattern of busy opens and closes and quiet middays; the cumulative variant compares the session's volume so far.
How to read it
High relative volume shows participation: a breakout, a gap or a move to a key level on RVOL well above 1 has more conviction than the same move on thin volume, and a climax of very high RVOL after a long move often marks exhaustion. Low RVOL shows a quiet market, where moves are easier to reverse.
Use the time-of-day modes for intraday charts: the first minutes after the open are always busy, so a prior-bars RVOL there looks high every day, while the time-of-day RVOL only rises when the open is busier than usual. The cumulative variant answers "is today busier than usual so far?" and is the steadier of the two.
Settings and limitations
Compare with picks the reference. Bars sets the prior-bars average (20 by default, excluding the current bar). Sessions sets how many earlier sessions are averaged at each time of day (10 by default); with fewer loaded, the available ones are used, and a bar with no earlier session shows nothing.
The time-of-day modes use regular-session bars (09:30 to 16:00 New York time, to 13:00 on early-close days); other bars show nothing in those modes, and the cumulative volume starts at 09:30. Load extra history (on in the Relative Volume at Time presets) loads two weeks of bars of the chart's own bar size, so the earlier sessions are there even when the chart has loaded only a few days; it is not available on seconds charts, and for a symbol with less history Spectral reports the history as unavailable, so switch it off there. On an extended-hours chart of 20-minute or 1 to 8 hour bars the extra history (bars from 09:30) does not line up with the chart's bars and is ignored. High RVOL sets the highlight multiple and its level.
Notes
The prior-bars mode is the common RVOL (volume divided by its simple moving average of the previous bars, as on most platforms, which usually include or exclude the current bar; Spectral excludes it so a spike does not dampen itself). The time-of-day modes follow TradingView's Relative Volume at Time (regular and cumulative), averaging the same bar time over the chosen number of earlier sessions. Compared with prior bars, the value updates live with the forming bar; the time-of-day modes update when each bar completes, since their average reads earlier sessions from all loaded bars.
On daily and longer charts the time-of-day modes show nothing (those bars have no time of day). On seconds charts each bar is compared with the bar at the same second on earlier sessions. On an extended-hours chart whose bars start before 09:30 (for example an hourly 09:00 bar), the bar holding the open is not part of the regular session, so the cumulative total starts with the first bar at or after 09:30. A session loaded from mid-day is left out of the cumulative average, and shows no cumulative value itself.
Settings
Each setting appears in the indicator's settings panel in Spectral, next to a color setting for every output.
| Setting | Type | Default | Range or options | What it does |
|---|---|---|---|---|
| Compare with | Choice | Prior bars | Prior bars, Time of day, Time of day (cumulative) | Prior bars: each bar against the average of the bars before it. Time of day: each bar against the bars at the same time on earlier sessions. Cumulative: the session's volume so far against the same time on earlier sessions. |
| Bars | Whole number | 20 | 1 – 500, step 1 | Prior bars: how many bars before the current one form the average. |
| Sessions | Whole number | 10 | 1 – 50, step 1 | Time of day: how many earlier sessions form the average at each time. |
| High RVOL | Number | 2 | 0.1 – 50, step 0.1 | Bars at or above this multiple are highlighted and the level is drawn there. |
| Load extra history | On / off | Off | — | Time of day: load two weeks of bars of the chart's bar size, for the earlier sessions the chart has not loaded. |
Presets
Each preset is its own entry in the Indicators toolbox, with these settings changed.
| Toolbox entry | Short name | Settings |
|---|---|---|
| Relative Volume at TimeUpdates at bar close | RVOL@T | Compare with: Time of dayLoad extra history: true |
| Relative Volume at Time (Cumulative)Updates at bar close | RVOL@T Cum | Compare with: Time of day (cumulative)Load extra history: true |
What it draws
Levels
- Averagedashed · 1 px
#8B949E - High RVOLdotted · 1 px
#E0B04A
Histograms
- RVOLhistogram bars
#6E8FB3 - High RVOLhistogram bars
#E0B04A
Source
Save it as relative-volume.js and add it with Indicators → Custom indicators → Add file…. The format is explained in the custom indicators guide.
// Copyright (c) 2026 Spectral
// SPDX-License-Identifier: MIT-0
// Free to use, copy, modify and share: https://spectral.trade/docs/custom-indicators/LICENSE.txt
/** @type {import('./spectral-indicator').IndicatorV2} */
export default {
  schemaVersion: 2,
  id: 'relative-volume',
  name: 'Relative Volume',
  shortName: 'RVOL',
  version: '1.0.3',
  author: 'Spectral',
  description: 'Volume as a multiple of normal: against the average of the prior bars, or against the same time of day on earlier sessions.',
  pane: 'oscillator',
  live: { lookback: 'length', barCloseWhen: { input: 'mode', in: ['Time of day', 'Time of day (cumulative)'] } },
  usesVolume: true,
  inputs: {
    mode: { type: 'select', label: 'Compare with', default: 'Prior bars', options: ['Prior bars', 'Time of day', 'Time of day (cumulative)'], description: 'Prior bars: each bar against the average of the bars before it. Time of day: each bar against the bars at the same time on earlier sessions. Cumulative: the session\'s volume so far against the same time on earlier sessions.' },
    length: { type: 'integer', label: 'Bars', default: 20, min: 1, max: 500, step: 1, description: 'Prior bars: how many bars before the current one form the average.' },
    sessions: { type: 'integer', label: 'Sessions', default: 10, min: 1, max: 50, step: 1, description: 'Time of day: how many earlier sessions form the average at each time.' },
    threshold: { type: 'number', label: 'High RVOL', default: 2, min: 0.1, max: 50, step: 0.1, description: 'Bars at or above this multiple are highlighted and the level is drawn there.' },
    loadHistory: { type: 'boolean', label: 'Load extra history', default: false, description: 'Time of day: load two weeks of bars of the chart\'s bar size, for the earlier sessions the chart has not loaded.' },
  },
  columns: {
    rvol: { label: 'RVOL', color: '#6E8FB3' },
    high: { label: 'High RVOL', color: '#E0B04A' },
  },
  levels: {
    average: { label: 'Average', color: '#8B949E', lineStyle: 'dashed' },
    threshold: { label: 'High RVOL', color: '#E0B04A', lineStyle: 'dotted' },
  },
  auxiliary: {
    history: { barSize: 'chart', duration: '2 W', useRth: true, when: { all: ['loadHistory'] } },
  },
  presets: [
    { id: 'time-of-day', name: 'Relative Volume at Time', shortName: 'RVOL@T', inputs: { mode: 'Time of day', loadHistory: true } },
    { id: 'cumulative', name: 'Relative Volume at Time (Cumulative)', shortName: 'RVOL@T Cum', inputs: { mode: 'Time of day (cumulative)', loadHistory: true } },
  ],
  docs: {
    overview: 'Relative Volume (RVOL) shows how unusual the current volume is: 1 means normal, 2 means twice the usual volume, 0.5 half of it. The bars turn gold at or above the High RVOL multiple.\n\nCompared with prior bars, each bar is measured against the average of the bars right before it. Compared with the time of day, each bar is measured against the same time on earlier sessions, which removes the normal intraday pattern of busy opens and closes and quiet middays; the cumulative variant compares the session\'s volume so far.',
    howToRead: 'High relative volume shows participation: a breakout, a gap or a move to a key level on RVOL well above 1 has more conviction than the same move on thin volume, and a climax of very high RVOL after a long move often marks exhaustion. Low RVOL shows a quiet market, where moves are easier to reverse.\n\nUse the time-of-day modes for intraday charts: the first minutes after the open are always busy, so a prior-bars RVOL there looks high every day, while the time-of-day RVOL only rises when the open is busier than usual. The cumulative variant answers "is today busier than usual so far?" and is the steadier of the two.',
    settings: 'Compare with picks the reference. Bars sets the prior-bars average (20 by default, excluding the current bar). Sessions sets how many earlier sessions are averaged at each time of day (10 by default); with fewer loaded, the available ones are used, and a bar with no earlier session shows nothing.\n\nThe time-of-day modes use regular-session bars (09:30 to 16:00 New York time, to 13:00 on early-close days); other bars show nothing in those modes, and the cumulative volume starts at 09:30. Load extra history (on in the Relative Volume at Time presets) loads two weeks of bars of the chart\'s own bar size, so the earlier sessions are there even when the chart has loaded only a few days; it is not available on seconds charts, and for a symbol with less history Spectral reports the history as unavailable, so switch it off there. On an extended-hours chart of 20-minute or 1 to 8 hour bars the extra history (bars from 09:30) does not line up with the chart\'s bars and is ignored. High RVOL sets the highlight multiple and its level.',
    notes: 'The prior-bars mode is the common RVOL (volume divided by its simple moving average of the previous bars, as on most platforms, which usually include or exclude the current bar; Spectral excludes it so a spike does not dampen itself). The time-of-day modes follow TradingView\'s Relative Volume at Time (regular and cumulative), averaging the same bar time over the chosen number of earlier sessions. Compared with prior bars, the value updates live with the forming bar; the time-of-day modes update when each bar completes, since their average reads earlier sessions from all loaded bars.\n\nOn daily and longer charts the time-of-day modes show nothing (those bars have no time of day). On seconds charts each bar is compared with the bar at the same second on earlier sessions. On an extended-hours chart whose bars start before 09:30 (for example an hourly 09:00 bar), the bar holding the open is not part of the regular session, so the cumulative total starts with the first bar at or after 09:30. A session loaded from mid-day is left out of the cumulative average, and shows no cumulative value itself.',
  },
  calculate(ctx) {
    const { bars, inputs, ta, time, auxiliary } = ctx;
    const count = bars.length;
    let ratio = new Array(count).fill(null);
    const volumeOf = (bar) => (Number.isFinite(bar.volume) && bar.volume > 0 ? bar.volume : 0);
    if (inputs.mode === 'Prior bars') {
      // The average of the Bars bars before each bar; a window without volume sums to exactly zero.
      const volumes = bars.map(volumeOf);
      const sums = ta.sum(volumes, inputs.length);
      ratio = volumes.map((volume, index) => {
        const sum = index >= inputs.length ? sums[index - 1] : null;
        const average = sum === null ? 0 : sum / inputs.length;
        return average > 0 ? volume / average : null;
      });
    } else {
      const cumulative = inputs.mode === 'Time of day (cumulative)';
      // Regular-session volume by New York date and second of the day (a seconds chart has several bars per minute);
      // the chart's own bars win over the extra history.
      const slotOf = (bar) => time.ny(bar).minutes * 60 + (((bar.time % 60) + 60) % 60);
      const sessions = new Map();
      const add = (bar, own) => {
        if (!time.isRegularSession(bar)) return;
        const dateKey = time.ny(bar).dateKey;
        const slot = slotOf(bar);
        let session = sessions.get(dateKey);
        if (!session) sessions.set(dateKey, session = new Map());
        if (own || !session.has(slot)) session.set(slot, volumeOf(bar));
      };
      // The extra history holds regular-hours bars, which start at the 09:30 open. It joins the chart's own bars only
      // when those sit on the same grid: an extended-hours chart whose bar size does not divide the open (20 minutes,
      // 1 to 8 hours) has its bars at other minutes, and both series in one session would count its volume twice.
      const size = barSeconds(ctx.barSize);
      let first = 0;
      while (first < count && !time.isRegularSession(bars[first])) first += 1;
      const grid = first < count ? slotOf(bars[first]) % size : -1;
      if (inputs.loadHistory) {
        for (const bar of auxiliary.history) if (slotOf(bar) % size === grid) add(bar, false);
      }
      for (const bar of bars) add(bar, true);
      const dates = [...sessions.keys()].sort();
      // Per session: its seconds of the day in order with the volume up to and including each.
      const ladders = new Map();
      for (const dateKey of dates) {
        const slots = [...sessions.get(dateKey).keys()].sort((a, b) => a - b);
        const totals = [];
        let total = 0;
        for (const slot of slots) {
          total += sessions.get(dateKey).get(slot);
          totals.push(total);
        }
        ladders.set(dateKey, { slots, totals });
      }
      const upTo = (dateKey, slot) => {
        const { slots, totals } = ladders.get(dateKey);
        let low = 0;
        let high = slots.length;
        while (low < high) {
          const middle = (low + high) >> 1;
          if (slots[middle] <= slot) low = middle + 1;
          else high = middle;
        }
        return low === 0 ? 0 : totals[low - 1];
      };
      const dateIndex = new Map(dates.map((dateKey, index) => [dateKey, index]));
      // A cumulative total is only comparable from the open: a session loaded from mid-day is left out.
      const openSlot = 570 * 60 + size;
      const fromOpen = (dateKey) => ladders.get(dateKey).slots[0] < openSlot;
      for (let index = 0; index < count; index += 1) {
        if (!time.isRegularSession(bars[index])) continue;
        const dateKey = time.ny(bars[index]).dateKey;
        const slot = slotOf(bars[index]);
        const own = dateIndex.get(dateKey);
        let sum = 0;
        let used = 0;
        for (let prior = own - 1; prior >= 0 && used < inputs.sessions; prior -= 1) {
          const session = sessions.get(dates[prior]);
          if (cumulative) {
            if (!fromOpen(dates[prior])) continue;
            sum += upTo(dates[prior], slot);
          } else if (session.has(slot)) sum += session.get(slot);
          else continue;
          used += 1;
        }
        if (used === 0 || sum <= 0 || (cumulative && !fromOpen(dateKey))) continue;
        const current = cumulative ? upTo(dateKey, slot) : volumeOf(bars[index]);
        ratio[index] = current / (sum / used);
      }
    }
    const rvol = ratio.map((value) => (value !== null && value < inputs.threshold ? value : null));
    const high = ratio.map((value) => (value !== null && value >= inputs.threshold ? value : null));
    return { columns: { rvol, high }, levels: { average: 1, threshold: inputs.threshold } };
  },
};

/** Seconds per bar of a Spectral bar size such as `5 secs`, `5 mins` or `1 hour`. */
function barSeconds(barSize) {
  const parts = String(barSize).split(' ');
  const amount = Number(parts[0]);
  const unit = parts.length > 1 ? parts[1] : 'min';
  const seconds = unit.startsWith('sec') ? 1 : unit.startsWith('hour') ? 3600 : unit.startsWith('day') ? 86400 : 60;
  return (Number.isFinite(amount) && amount > 0 ? amount : 1) * seconds;
}
Adapt it with an LLM
Paste this into your assistant and replace the second-to-last line with the change you want.
Start from this Spectral custom indicator: https://spectral.trade/indicators/relative-volume.js
Format reference: https://spectral.trade/docs/custom-indicators.llm.md
Keep the file format and every rule of the reference; give the result a new id, name, shortName and version, and update docs and input descriptions to match.
Keep its live updates exact and fast (section "Fast live updates" of the reference): carry values from bar to bar only through ctx.ta, and raise live.lookback if the change reads further back; Spectral rejects a file whose live updates differ from a full recalculation or are too slow.
Change I want: <describe the change>
Answer with the complete file in one code block, ready to save as <id>.js.
Related indicators
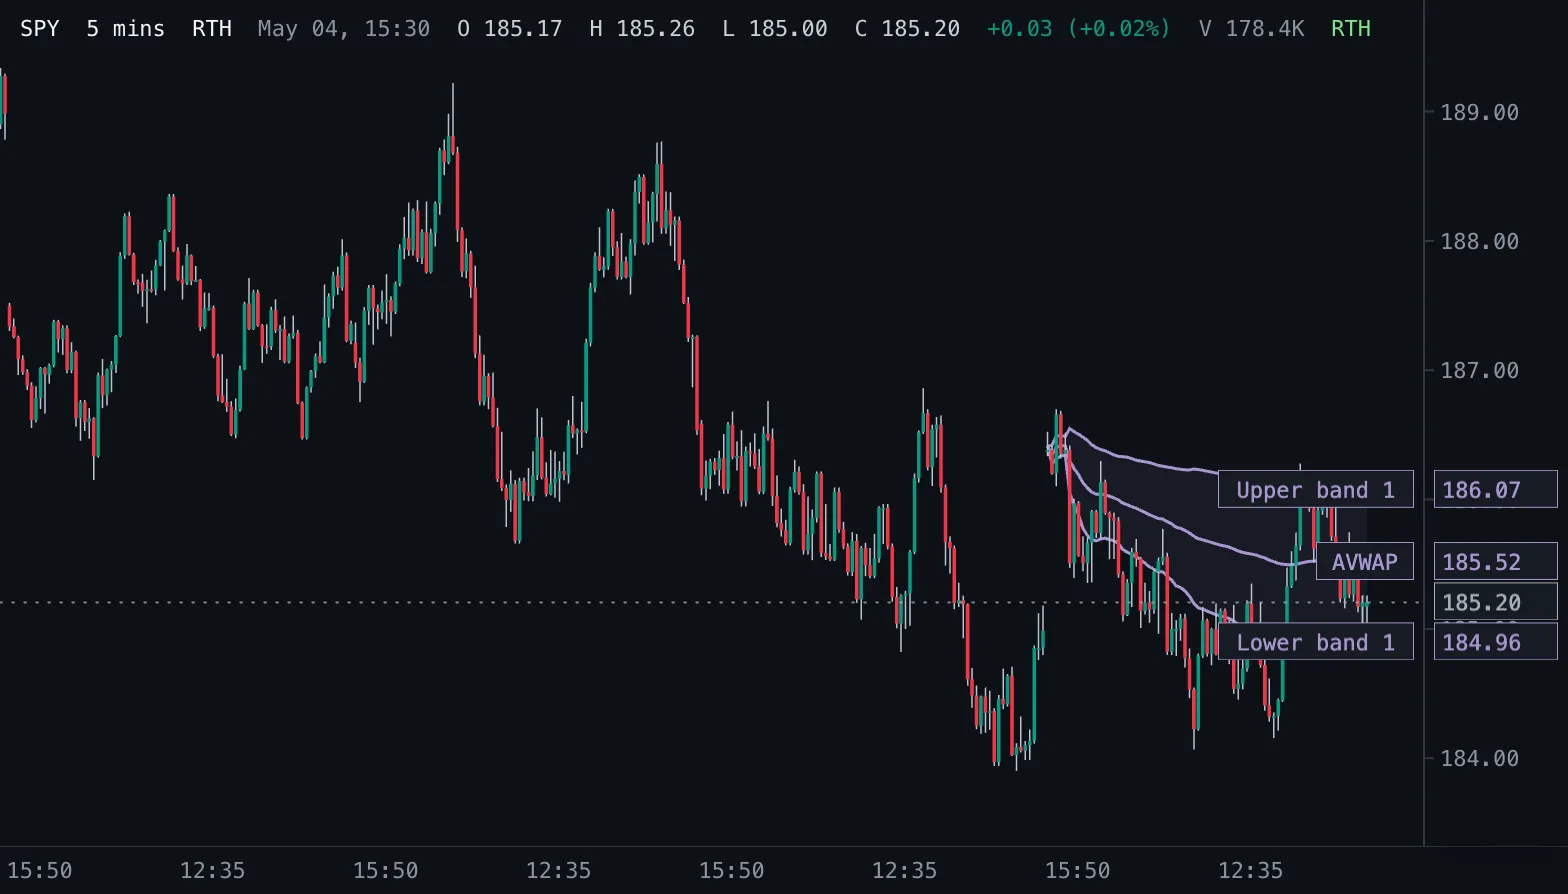
Anchored VWAP AVWAP
Volume-weighted average price counted from a chosen start time, with optional volume-weighted standard deviation bands.
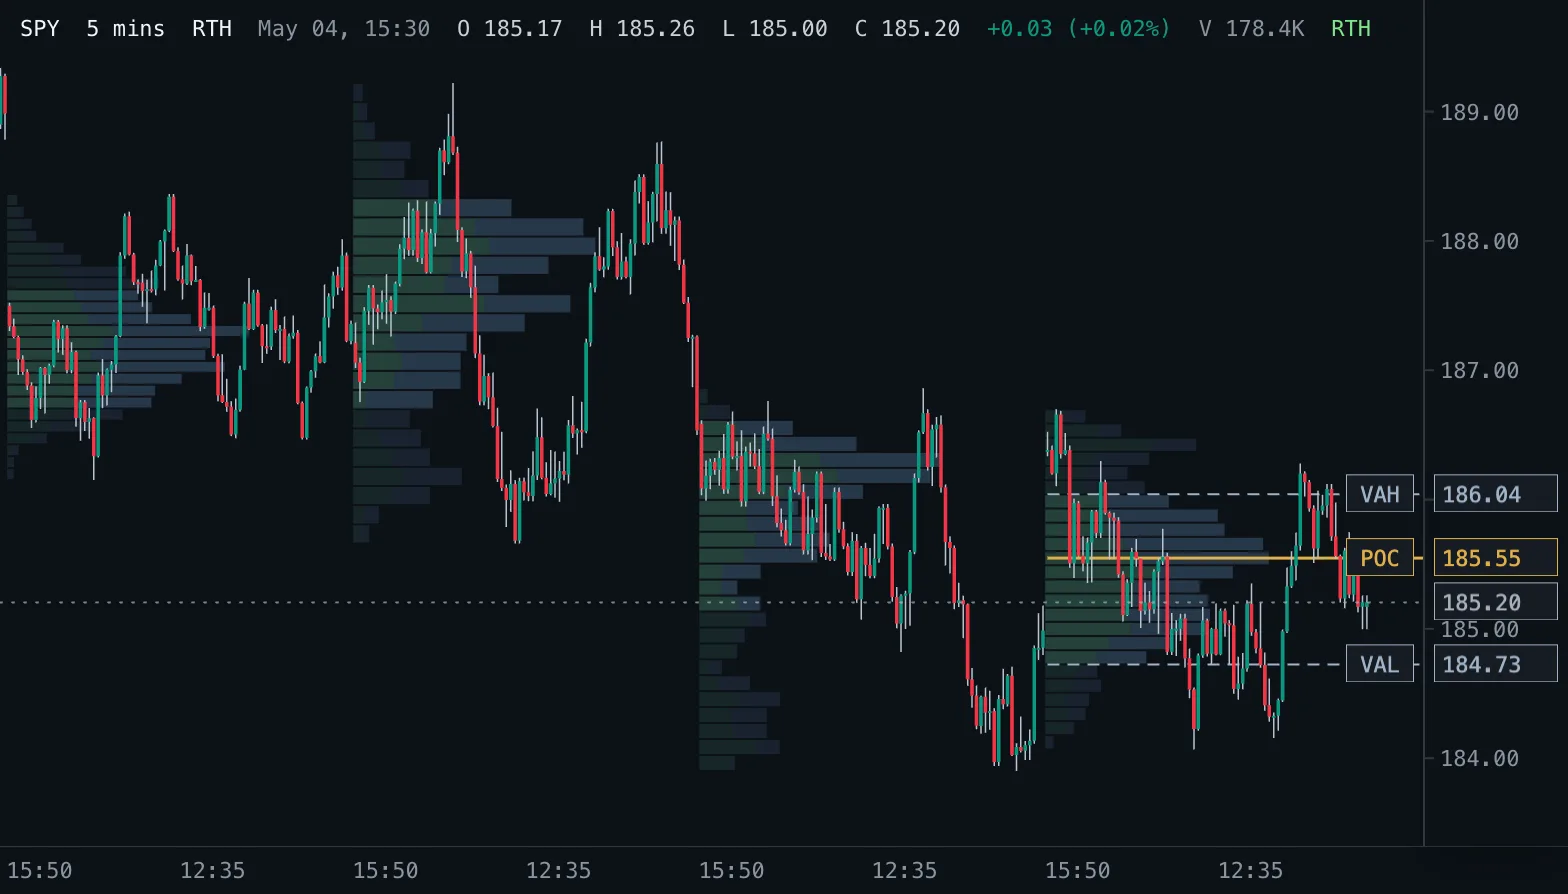
Volume Profile VP
Volume traded at each price as horizontal rows, per session, over a fixed range or for the bars on screen, with point of control and value area.
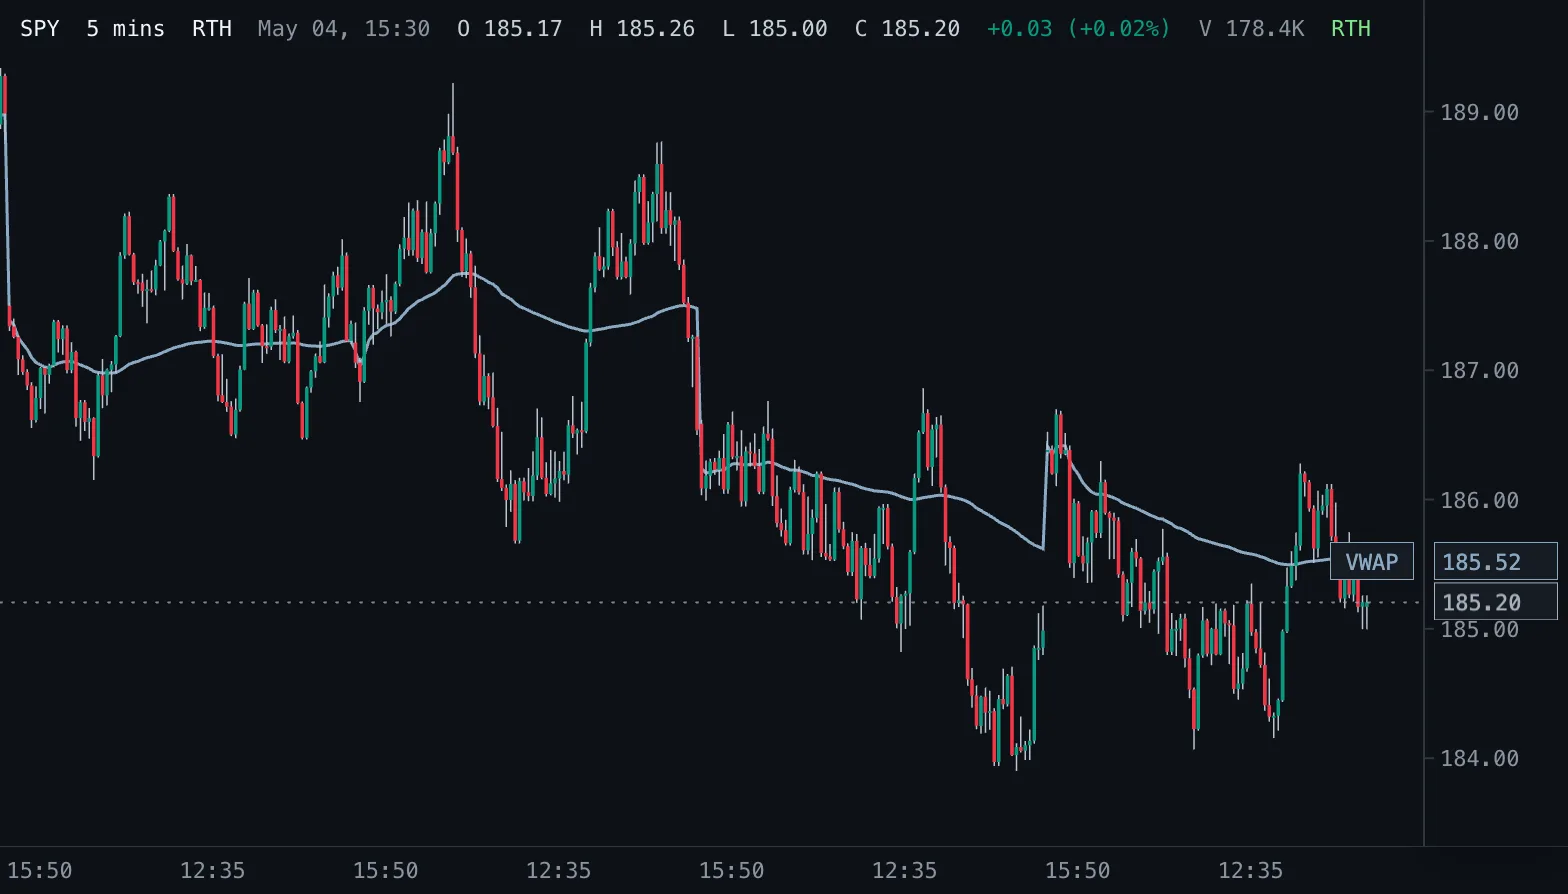
VWAP VWAP
Session volume-weighted average price that starts fresh on every New York trading date.