Volume Profile
Volume traded at each price as horizontal rows, per session, over a fixed range or for the bars on screen, with point of control and value area.
- VP
- Built into Spectral
- Updates at bar close
- Uses volume
- volume profile
- volume at price
- point of control
- value area
- session profile
- fixed range
- visible range
MIT-0: free to use, change and share, no attribution needed. What you build from it is yours.
Already in Spectral: add it from the Indicators toolbox. The file here is the same indicator written as a custom indicator, to change or learn from. Installed, it appears next to the built-in one, marked Custom.
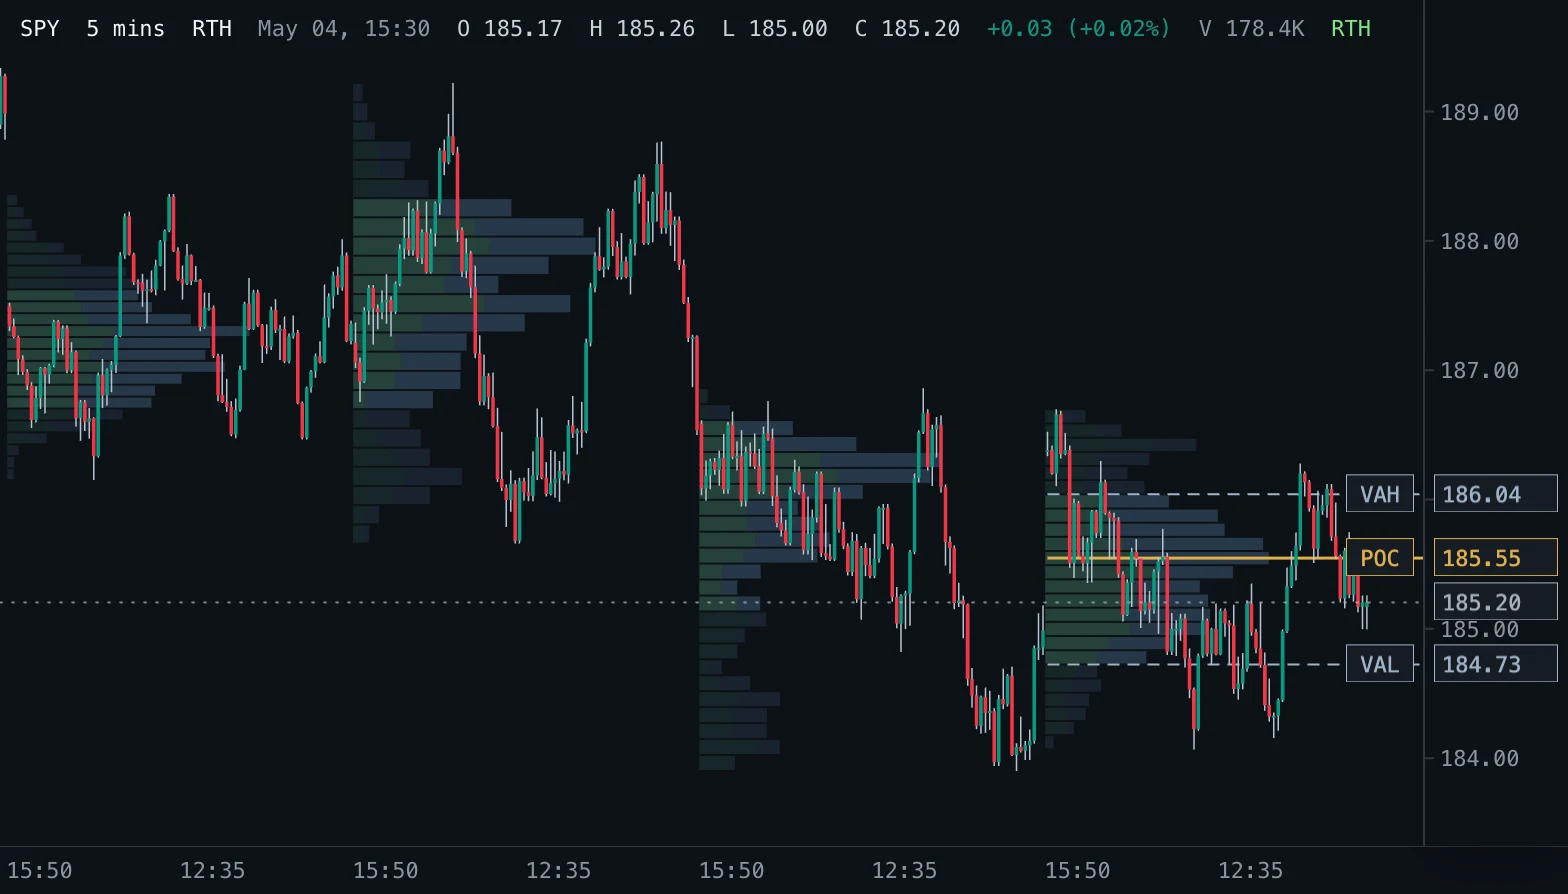
Overview
Volume Profile shows how much volume traded at each price, as horizontal rows next to the candles. Long rows are prices where the market did a lot of business; short rows are prices it passed through quickly.
Three profiles are available: one per trading day (Session), one between two moments you choose (Fixed range), and one of the bars currently on screen (Visible range), which follows you as you scroll and zoom. Each marks the point of control (POC, the price with the most volume) and the value area (where the chosen share of the volume traded, usually 70%).
How to read it
The point of control and the value area are where buyers and sellers agreed on price. Prices near the POC tend to attract and hold price; thin rows (low-volume areas) are often crossed fast, and price that leaves them tends to travel to the next high-volume area.
Inside the value area the market is balanced; acceptance outside it (price holding beyond the value area high or low) suggests the market is looking for a new value, while a quick return inside suggests the move was rejected. The green share of each row traded on up bars, the blue share on down bars.
Settings and limitations
Profile picks Session, Fixed range or Visible range. Rows sets how finely each profile is divided; Value area % sets the share of volume in the value area (70% is the common choice). Sessions limits how many recent trading days get a session profile (fewer when many rows are chosen, so that all rows stay within the drawing budget).
From and To set the fixed range as New York date and time, from the bar that contains From to the bar that contains To; From not set (or earlier than the loaded bars) starts at the first loaded bar, To not set ends at the last bar. Up and down volume splits each row by bar direction. POC and value area lines draws the POC, VAH and VAL of the latest session or of the fixed range as levels; the visible-range profile marks its value area with brighter rows instead, because it changes with every scroll.
Notes
Spectral only has the chart's bars, not the trades inside them, so each bar's volume is spread evenly across its high-low range; platforms that read lower-timeframe or tick data (TradingView with intrabar data) place volume more exactly, and long bars blur the profile more than short ones. A bar counts as up when it closes at or above its open. The value area grows one row at a time from the POC toward the busier neighbouring row until it holds the chosen share; some platforms compare two rows at a time, which can move the edges by a row.
Sessions are New York trading dates, so on an extended-hours chart a session profile includes pre- and post-market bars. The visible-range profile divides the whole loaded price range into one fine grid and groups it into Rows rows for the prices on screen; when the chart holds many bars, a very short zoom range shows fewer distinct rows. The rows and the POC, VAH and VAL lines update when each bar completes, so the forming bar counts once it closes. Needs a Spectral version with schemaVersion 2.
Settings
Each setting appears in the indicator's settings panel in Spectral, next to a color setting for every output.
| Setting | Type | Default | Range or options | What it does |
|---|---|---|---|---|
| Profile | Choice | Session | Session, Fixed range, Visible range | Session: one profile per trading day. Fixed range: one profile between From and To. Visible range: one profile of the bars on screen, drawn at the right edge. |
| Rows | Whole number | 24 | 4 – 200, step 1 | Number of price rows each profile is divided into. |
| Value area % | Number | 70 | 10 – 100, step 1 | Share of the volume, around the point of control, that forms the value area. |
| Sessions | Whole number | 20 | 1 – 200, step 1 | Session profile only: how many of the most recent trading days get a profile. |
| From | Date and time | Not set | — | Fixed range only: the first bar of the profile. Not set: the first loaded bar. |
| To | Date and time | Not set | — | Fixed range only: the last bar of the profile. Not set: the last bar. |
| Up and down volume | On / off | On | — | Split each row into the volume of up bars and down bars. |
| POC and value area lines | On / off | On | — | Draw the point of control and the value area high and low of the latest session or the fixed range as levels. |
Presets
Each preset is its own entry in the Indicators toolbox, with these settings changed.
| Toolbox entry | Short name | Settings |
|---|---|---|
| Volume Profile (Fixed Range) | VPFR | Profile: Fixed range |
| Volume Profile (Visible Range) | VPVR | Profile: Visible range |
What it draws
Levels
- POCsolid · 1.5 px · value on the axis
#E0B04A - VAHdashed · 1 px · value on the axis
#9FB3C8 - VALdashed · 1 px · value on the axis
#9FB3C8
Volume profiles
- Profileprofile per range
#5B7FA6 - Visible range profilevisible-range profile at the right edge
#5B7FA6
Source
Save it as volume-profile.js and add it with Indicators → Custom indicators → Add file…. The format is explained in the custom indicators guide.
// Copyright (c) 2026 Spectral
// SPDX-License-Identifier: MIT-0
// Free to use, copy, modify and share: https://spectral.trade/docs/custom-indicators/LICENSE.txt
/** @type {import('./spectral-indicator').IndicatorV2} */
export default {
  schemaVersion: 2,
  id: 'volume-profile',
  name: 'Volume Profile',
  shortName: 'VP',
  version: '1.0.0',
  author: 'Spectral',
  description: 'Volume traded at each price as horizontal rows, per session, over a fixed range or for the bars on screen, with point of control and value area.',
  pane: 'price',
  live: 'none',
  usesVolume: true,
  inputs: {
    mode: { type: 'select', label: 'Profile', default: 'Session', options: ['Session', 'Fixed range', 'Visible range'], description: 'Session: one profile per trading day. Fixed range: one profile between From and To. Visible range: one profile of the bars on screen, drawn at the right edge.' },
    rows: { type: 'integer', label: 'Rows', default: 24, min: 4, max: 200, step: 1, description: 'Number of price rows each profile is divided into.' },
    valueArea: { type: 'number', label: 'Value area %', default: 70, min: 10, max: 100, step: 1, description: 'Share of the volume, around the point of control, that forms the value area.' },
    sessions: { type: 'integer', label: 'Sessions', default: 20, min: 1, max: 200, step: 1, description: 'Session profile only: how many of the most recent trading days get a profile.' },
    fromTime: { type: 'time', label: 'From', default: 0, description: 'Fixed range only: the first bar of the profile. Not set: the first loaded bar.' },
    toTime: { type: 'time', label: 'To', default: 0, description: 'Fixed range only: the last bar of the profile. Not set: the last bar.' },
    upDown: { type: 'boolean', label: 'Up and down volume', default: true, description: 'Split each row into the volume of up bars and down bars.' },
    showLevels: { type: 'boolean', label: 'POC and value area lines', default: true, description: 'Draw the point of control and the value area high and low of the latest session or the fixed range as levels.' },
  },
  levels: {
    poc: { label: 'POC', color: '#E0B04A', lineWidth: 1.5, lineStyle: 'solid', showValue: true },
    vah: { label: 'VAH', color: '#9FB3C8', lineStyle: 'dashed', showValue: true },
    val: { label: 'VAL', color: '#9FB3C8', lineStyle: 'dashed', showValue: true },
  },
  profiles: {
    profile: { label: 'Profile', color: '#5B7FA6', upColor: '#4E9A7A', opacity: 0.35, placement: 'range' },
    visibleProfile: { label: 'Visible range profile', color: '#5B7FA6', upColor: '#4E9A7A', opacity: 0.35, placement: 'visible' },
  },
  presets: [
    { id: 'fixed-range', name: 'Volume Profile (Fixed Range)', shortName: 'VPFR', inputs: { mode: 'Fixed range' } },
    { id: 'visible-range', name: 'Volume Profile (Visible Range)', shortName: 'VPVR', inputs: { mode: 'Visible range' } },
  ],
  docs: {
    overview: 'Volume Profile shows how much volume traded at each price, as horizontal rows next to the candles. Long rows are prices where the market did a lot of business; short rows are prices it passed through quickly.\n\nThree profiles are available: one per trading day (Session), one between two moments you choose (Fixed range), and one of the bars currently on screen (Visible range), which follows you as you scroll and zoom. Each marks the point of control (POC, the price with the most volume) and the value area (where the chosen share of the volume traded, usually 70%).',
    howToRead: 'The point of control and the value area are where buyers and sellers agreed on price. Prices near the POC tend to attract and hold price; thin rows (low-volume areas) are often crossed fast, and price that leaves them tends to travel to the next high-volume area.\n\nInside the value area the market is balanced; acceptance outside it (price holding beyond the value area high or low) suggests the market is looking for a new value, while a quick return inside suggests the move was rejected. The green share of each row traded on up bars, the blue share on down bars.',
    settings: 'Profile picks Session, Fixed range or Visible range. Rows sets how finely each profile is divided; Value area % sets the share of volume in the value area (70% is the common choice). Sessions limits how many recent trading days get a session profile (fewer when many rows are chosen, so that all rows stay within the drawing budget).\n\nFrom and To set the fixed range as New York date and time, from the bar that contains From to the bar that contains To; From not set (or earlier than the loaded bars) starts at the first loaded bar, To not set ends at the last bar. Up and down volume splits each row by bar direction. POC and value area lines draws the POC, VAH and VAL of the latest session or of the fixed range as levels; the visible-range profile marks its value area with brighter rows instead, because it changes with every scroll.',
    notes: 'Spectral only has the chart\'s bars, not the trades inside them, so each bar\'s volume is spread evenly across its high-low range; platforms that read lower-timeframe or tick data (TradingView with intrabar data) place volume more exactly, and long bars blur the profile more than short ones. A bar counts as up when it closes at or above its open. The value area grows one row at a time from the POC toward the busier neighbouring row until it holds the chosen share; some platforms compare two rows at a time, which can move the edges by a row.\n\nSessions are New York trading dates, so on an extended-hours chart a session profile includes pre- and post-market bars. The visible-range profile divides the whole loaded price range into one fine grid and groups it into Rows rows for the prices on screen; when the chart holds many bars, a very short zoom range shows fewer distinct rows. The rows and the POC, VAH and VAL lines update when each bar completes, so the forming bar counts once it closes. Needs a Spectral version with schemaVersion 2.',
  },
  calculate(ctx) {
    const { bars, inputs, time } = ctx;
    const empty = { profiles: { profile: null, visibleProfile: null }, levels: { poc: null, vah: null, val: null } };
    if (bars.length === 0) return empty;
    const rowCount = inputs.rows;
    const share = inputs.valueArea / 100;
    const splitUp = inputs.upDown;
    const isUp = (bar) => bar.close >= bar.open;

    if (inputs.mode === 'Visible range') {
      return { profiles: { profile: null, visibleProfile: visibleBins(bars, rowCount, inputs.valueArea, splitUp, isUp) }, levels: empty.levels };
    }

    const ranges = [];
    if (inputs.mode === 'Fixed range') {
      let fromTime = inputs.fromTime;
      let toTime = inputs.toTime;
      if (fromTime > 0 && toTime > 0 && fromTime > toTime) [fromTime, toTime] = [toTime, fromTime];
      // From starts at the bar that contains the moment (or the first bar after a gap), as Anchored VWAP does.
      let fromIndex = fromTime > 0 ? barContaining(bars, fromTime, barSeconds(ctx.barSize)) : 0;
      if (fromIndex < 0) fromIndex = bars.length;
      let toIndex = bars.length - 1;
      if (toTime > 0) while (toIndex >= 0 && bars[toIndex].time > toTime) toIndex -= 1;
      if (fromIndex <= toIndex) ranges.push([fromIndex, toIndex]);
    } else {
      // Most recent sessions first, then restored to time order; all rows stay within the 16,000-row budget.
      const limit = Math.max(1, Math.min(inputs.sessions, Math.floor(16000 / rowCount)));
      let end = bars.length - 1;
      while (end >= 0 && ranges.length < limit) {
        const dateKey = time.ny(bars[end]).dateKey;
        let start = end;
        while (start > 0 && time.ny(bars[start - 1]).dateKey === dateKey) start -= 1;
        ranges.push([start, end]);
        end = start - 1;
      }
      ranges.reverse();
    }

    const profiles = ranges.map(([fromIndex, toIndex]) => rangeProfile(bars, fromIndex, toIndex, rowCount, share, splitUp, isUp));
    const latest = profiles[profiles.length - 1];
    const levels = { poc: null, vah: null, val: null };
    if (inputs.showLevels && latest && latest.poc !== null) {
      levels.poc = { price: latest.poc, fromIndex: latest.fromIndex };
      levels.vah = { price: latest.valueAreaHigh, fromIndex: latest.fromIndex };
      levels.val = { price: latest.valueAreaLow, fromIndex: latest.fromIndex };
    }
    return {
      profiles: {
        profile: profiles.map(({ poc: _poc, ...profile }) => profile),
        visibleProfile: null,
      },
      levels,
    };
  },
};

/** Spreads one bar's volume over the rows of a grid (origin `low`, row height `height`) by price overlap. */
function spread(bar, low, height, firstLimit, lastLimit, visit) {
  const first = Math.max(firstLimit, Math.min(lastLimit, Math.floor((bar.low - low) / height)));
  const last = Math.max(first, Math.min(lastLimit, Math.floor((bar.high - low) / height)));
  const span = bar.high - bar.low;
  if (span <= 0 || first === last) {
    visit(first, 1);
    return;
  }
  for (let row = first; row <= last; row += 1) {
    const top = Math.min(bar.high, low + (row + 1) * height);
    const bottom = Math.max(bar.low, low + row * height);
    visit(row, Math.max(0, top - bottom) / span);
  }
}

/** The value-area row span: from the busiest row toward the busier neighbour until it holds `share` of the volume. */
function valueArea(volume, share) {
  let poc = 0;
  let total = 0;
  for (let row = 0; row < volume.length; row += 1) {
    total += volume[row];
    if (volume[row] > volume[poc]) poc = row;
  }
  let lowRow = poc;
  let highRow = poc;
  let inside = volume[poc];
  while (inside < total * share && (lowRow > 0 || highRow < volume.length - 1)) {
    const below = lowRow > 0 ? volume[lowRow - 1] : -1;
    const above = highRow < volume.length - 1 ? volume[highRow + 1] : -1;
    if (above >= below) inside += volume[++highRow];
    else inside += volume[--lowRow];
  }
  return { poc, lowRow, highRow, total };
}

function rangeProfile(bars, fromIndex, toIndex, rowCount, share, splitUp, isUp) {
  let low = Infinity;
  let high = -Infinity;
  for (let index = fromIndex; index <= toIndex; index += 1) {
    low = Math.min(low, bars[index].low);
    high = Math.max(high, bars[index].high);
  }
  const rows = high > low ? rowCount : 1;
  const height = high > low ? (high - low) / rows : Math.max(Math.abs(low) * 1e-4, 1e-8);
  const volume = new Array(rows).fill(0);
  const up = new Array(rows).fill(0);
  for (let index = fromIndex; index <= toIndex; index += 1) {
    const bar = bars[index];
    const barVolume = bar.volume || 0;
    if (barVolume <= 0) continue;
    const upBar = isUp(bar);
    spread(bar, low, height, 0, rows - 1, (row, part) => {
      volume[row] += barVolume * part;
      if (upBar) up[row] += barVolume * part;
    });
  }
  const area = valueArea(volume, share);
  const profileRows = volume.map((rowVolume, row) => ({
    low: low + row * height,
    high: low + (row + 1) * height,
    volume: rowVolume,
    ...(splitUp ? { up: Math.min(rowVolume, up[row]) } : {}),
  }));
  if (area.total <= 0) return { fromIndex, toIndex, rows: profileRows, poc: null };
  return {
    fromIndex, toIndex, rows: profileRows,
    valueAreaLow: low + area.lowRow * height,
    valueAreaHigh: low + (area.highRow + 1) * height,
    poc: low + (area.poc + 0.5) * height,
  };
}

/** Each bar's volume on one fine grid over the loaded price range; the chart sums the bars on screen. */
function visibleBins(bars, rowCount, valueAreaPercent, splitUp, isUp) {
  let low = Infinity;
  let high = -Infinity;
  for (const bar of bars) {
    low = Math.min(low, bar.low);
    high = Math.max(high, bar.high);
  }
  // A fine grid (2,000 rows over the loaded range), coarsened until every bar's rows fit the 64,000-number budget.
  let height = high > low ? (high - low) / 2000 : Math.max(Math.abs(low) * 1e-4, 1e-8);
  for (let attempt = 0; attempt < 12; attempt += 1) {
    let entries = 0;
    for (const bar of bars) {
      if ((bar.volume || 0) > 0) entries += Math.floor((bar.high - low) / height) - Math.floor((bar.low - low) / height) + 1;
    }
    if (entries <= 60000) break;
    height *= (entries / 60000) * 1.05;
  }
  const lastRow = Math.max(0, Math.floor((high - low) / height));
  const perBar = bars.map((bar) => {
    const barVolume = bar.volume || 0;
    if (barVolume <= 0) return null;
    const first = Math.max(0, Math.min(lastRow, Math.floor((bar.low - low) / height)));
    const volume = [];
    const up = [];
    const upBar = isUp(bar);
    spread(bar, low, height, 0, lastRow, (row, part) => {
      volume[row - first] = (volume[row - first] || 0) + barVolume * part;
      up[row - first] = upBar ? volume[row - first] : 0;
    });
    for (let slot = 0; slot < volume.length; slot += 1) {
      if (volume[slot] === undefined) volume[slot] = 0;
      if (up[slot] === undefined) up[slot] = 0;
    }
    return splitUp ? { row: first, volume, up } : { row: first, volume };
  });
  return { priceLow: low, rowHeight: height, rows: rowCount, valueArea: valueAreaPercent, bars: perBar };
}

function barSeconds(barSize) {
  const parts = String(barSize).split(' ');
  const amount = Number(parts[0]);
  const unit = parts.length > 1 ? parts[1] : 'min';
  let seconds = 60;
  if (unit.startsWith('sec')) seconds = 1;
  else if (unit.startsWith('hour')) seconds = 3600;
  else if (unit.startsWith('day')) seconds = 86400;
  else if (unit.startsWith('week')) seconds = 604800;
  else if (unit.startsWith('month')) seconds = 2678400;
  return (Number.isFinite(amount) && amount > 0 ? amount : 1) * seconds;
}

/** The bar that contains `moment`, or the first bar after it in a gap; 0 before the first bar, -1 after the last. */
function barContaining(bars, moment, seconds) {
  const last = bars.length - 1;
  if (last < 0) return -1;
  if (moment <= bars[0].time) return 0;
  let low = 0;
  let high = last;
  while (low < high) {
    const middle = Math.ceil((low + high) / 2);
    if (bars[middle].time <= moment) low = middle;
    else high = middle - 1;
  }
  const end = low < last ? Math.min(bars[low + 1].time, bars[low].time + seconds) : bars[low].time + seconds;
  if (moment < end) return low;
  return low < last ? low + 1 : -1;
}
Adapt it with an LLM
Paste this into your assistant and replace the second-to-last line with the change you want.
Start from this Spectral custom indicator: https://spectral.trade/indicators/volume-profile.js
Format reference: https://spectral.trade/docs/custom-indicators.llm.md
Keep the file format and every rule of the reference; give the result a new id, name, shortName and version, and update docs and input descriptions to match.
Keep its live updates exact and fast (section "Fast live updates" of the reference): carry values from bar to bar only through ctx.ta, and raise live.lookback if the change reads further back; Spectral rejects a file whose live updates differ from a full recalculation or are too slow.
Change I want: <describe the change>
Answer with the complete file in one code block, ready to save as <id>.js.
Related indicators
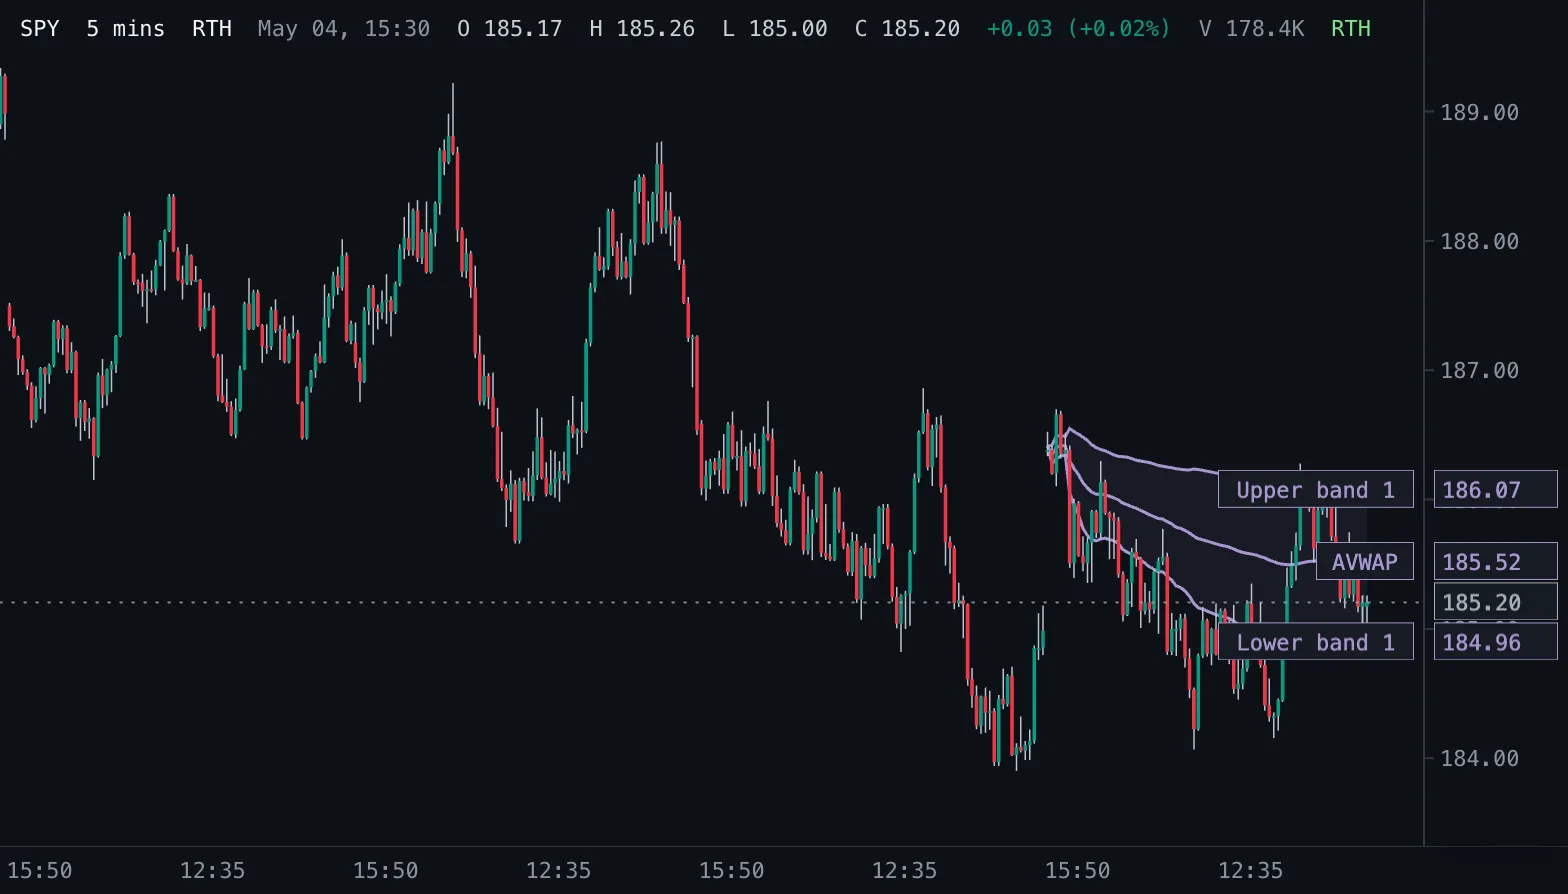
Anchored VWAP AVWAP
Volume-weighted average price counted from a chosen start time, with optional volume-weighted standard deviation bands.
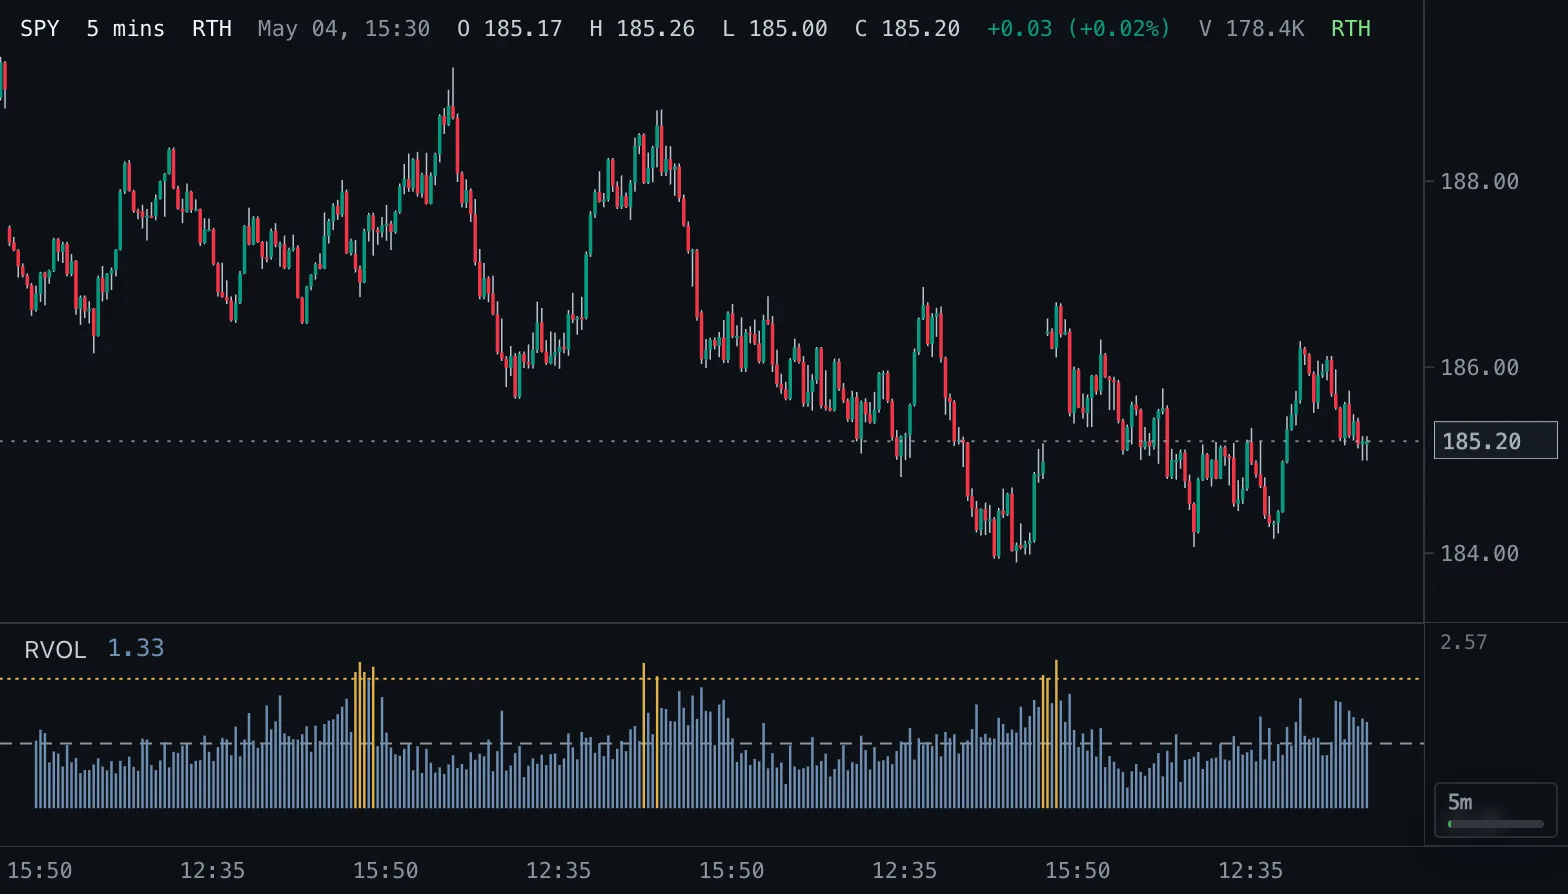
Relative Volume RVOL
Volume as a multiple of normal: against the average of the prior bars, or against the same time of day on earlier sessions.
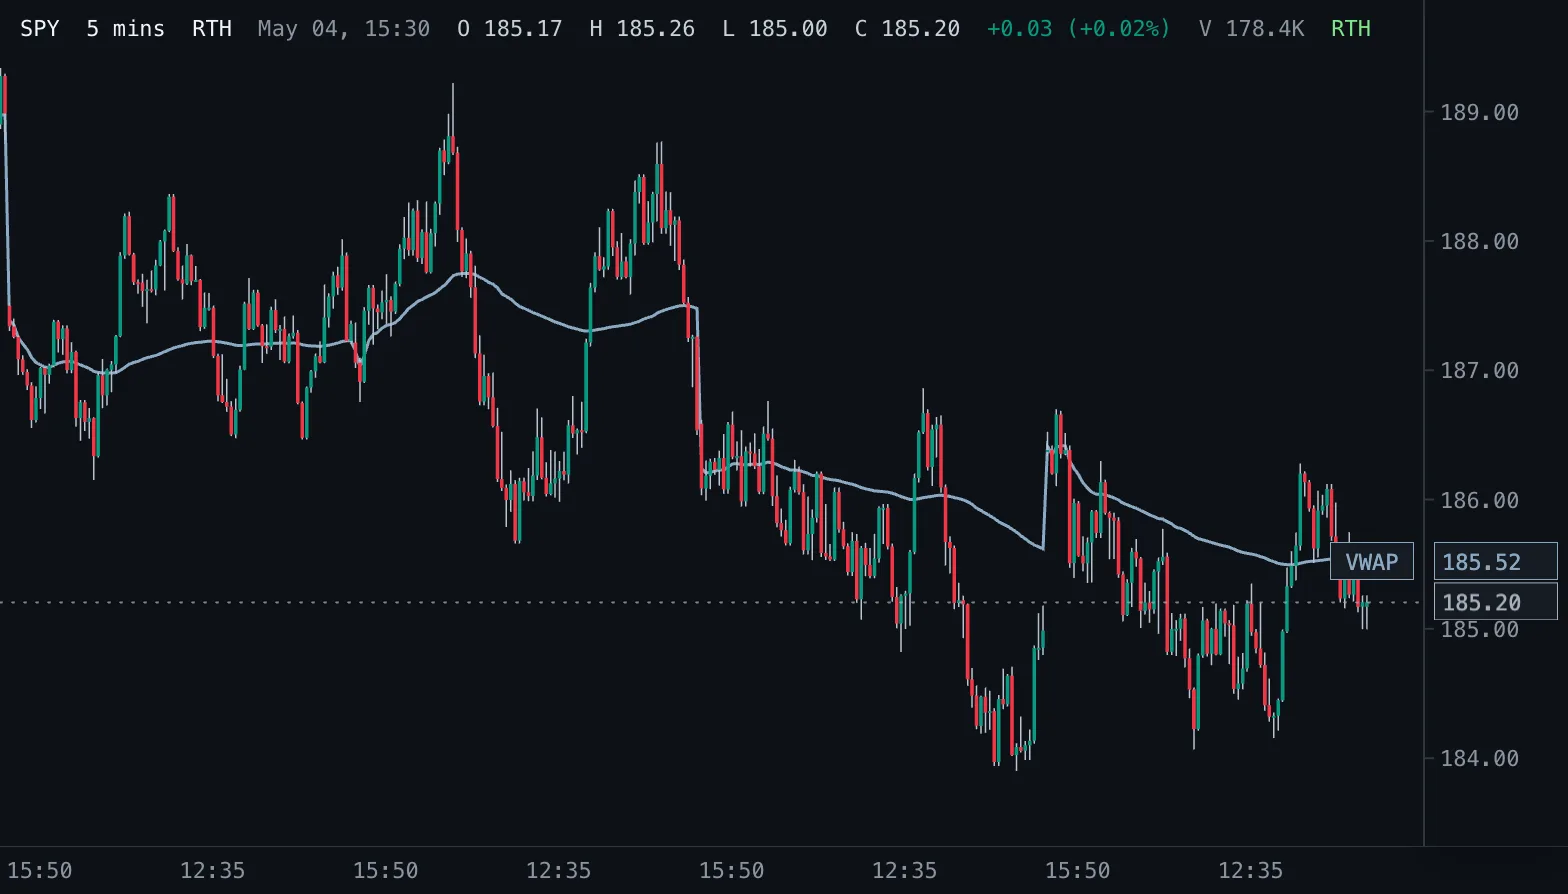
VWAP VWAP
Session volume-weighted average price that starts fresh on every New York trading date.