Zig Zag
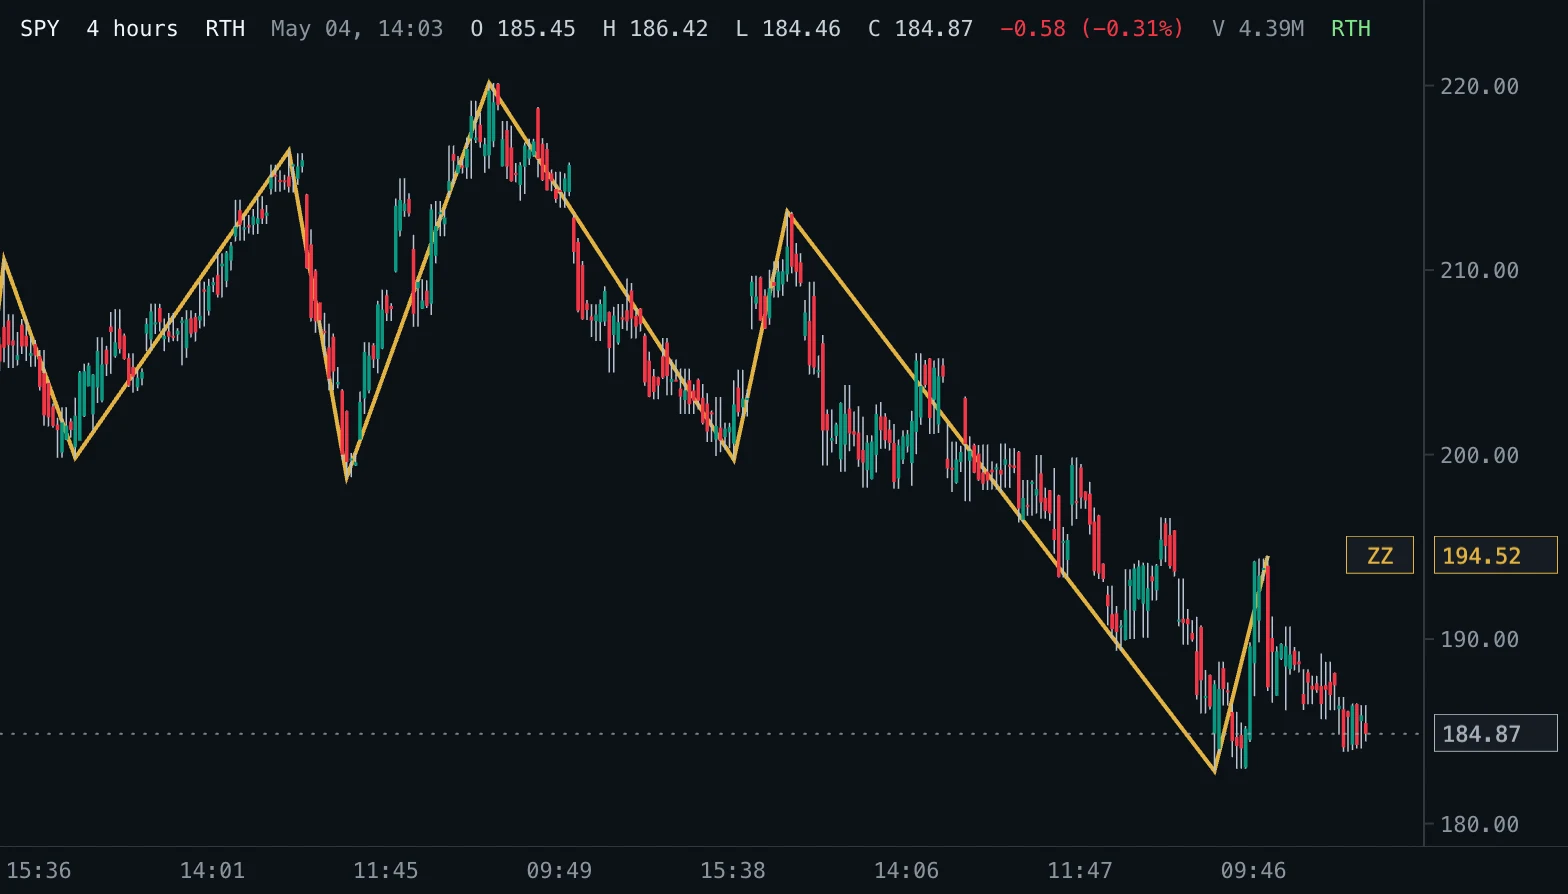
A line through the confirmed swing highs and lows that filters out moves smaller than the deviation percent.
- ZZ
- Built into Spectral
- Updates at bar close
- zig zag
- swing highs
- swing lows
- market structure
- trend
- waves
MIT-0: free to use, change and share, no attribution needed. What you build from it is yours.
Already in Spectral: add it from the Indicators toolbox. The file here is the same indicator written as a custom indicator, to change or learn from. Installed, it appears next to the built-in one, marked Custom.
Overview
Zig Zag connects the swing highs and lows of the chart and ignores every move smaller than the deviation. A swing high is a bar whose high stands above the highs of the bars around it (half the depth on each side); a swing low is the mirror image. Swings alternate: a new swing in the other direction counts only once price has moved at least the deviation percent from the last swing, and a higher high (or lower low) in the same direction moves the last swing there.
The result is the market's skeleton: the legs traders measure for trend structure, retracements and wave counts.
How to read it
Higher swing highs and higher swing lows describe an uptrend, lower highs and lower lows a downtrend; a break of that sequence is the first sign the structure is changing. The length and duration of the legs show whether moves with the trend are getting stronger or weaker than the pullbacks against it.
Zig Zag looks back by construction: a swing is confirmed only half the depth bars after it printed, so the line ends at the last confirmed swing, not at the current price. That last leg can repaint: its end moves while price keeps extending in the same direction, until a swing the other way is confirmed. Use the line for structure, not as a signal.
Settings and limitations
Deviation sets how big a move must be to count as a new swing. The default of 5 percent suits daily charts; on intraday charts use 0.5 to 2 percent (the intraday preset uses 1 percent), or the line shows only a few legs. Depth sets how many bars a swing must stand out against; the default of 10 (5 on each side, never fewer than 2) follows TradingView.
The first swing appears once half the depth bars have printed after it. New swings are confirmed when a bar closes.
Notes
Follows TradingView's Zig Zag: swings are highs and lows that stand out against half the depth bars on each side, a turn needs a move of the deviation percent in its own direction, and the last swing moves to a more extreme price in the same direction. When one bar is both a swing high and a swing low, the turn away from the last swing is tried first, and the bar counts once. TradingView can also extend the line to the current bar; this indicator draws confirmed swings only. MetaTrader's ZigZag uses a backstep instead and can differ on fast, choppy legs.
Settings
Each setting appears in the indicator's settings panel in Spectral, next to a color setting for every output.
| Setting | Type | Default | Range or options | What it does |
|---|---|---|---|---|
| Deviation (%) | Number | 5 | 0 – 100, step 0.1 | The smallest move, in percent of the last swing price, that starts a new swing in the other direction. |
| Depth | Whole number | 10 | 2 – 100 | Bars a swing high or low must stand out against: half of them, but at least 2, on each side. A larger depth finds fewer, bigger swings. |
Presets
Each preset is its own entry in the Indicators toolbox, with these settings changed.
| Toolbox entry | Short name | Settings |
|---|---|---|
| Zig Zag (intraday, 1%) | ZZ 1% | Deviation (%): 1 |
| Zig Zag (major swings, 10%) | ZZ 10% | Deviation (%): 10Depth: 20 |
What it draws
Lines
- Zig Zagsolid · 2 px · primary
#E3B341
Source
Save it as zig-zag.js and add it with Indicators → Custom indicators → Add file…. The format is explained in the custom indicators guide.
// Copyright (c) 2026 Spectral
// SPDX-License-Identifier: MIT-0
// Free to use, copy, modify and share: https://spectral.trade/docs/custom-indicators/LICENSE.txt
/** @type {import('./spectral-indicator').IndicatorV2} */
export default {
  schemaVersion: 2,
  id: 'zig-zag',
  name: 'Zig Zag',
  shortName: 'ZZ',
  version: '1.0.0',
  author: 'Spectral',
  description: 'A line through the confirmed swing highs and lows that filters out moves smaller than the deviation percent.',
  pane: 'price',
  live: 'none',
  inputs: {
    deviation: { type: 'number', label: 'Deviation (%)', default: 5, min: 0, max: 100, step: 0.1, description: 'The smallest move, in percent of the last swing price, that starts a new swing in the other direction.' },
    depth: { type: 'integer', label: 'Depth', default: 10, min: 2, max: 100, description: 'Bars a swing high or low must stand out against: half of them, but at least 2, on each side. A larger depth finds fewer, bigger swings.' },
  },
  plots: {
    zigZag: { label: 'Zig Zag', color: '#E3B341', lineWidth: 2, primary: true },
  },
  presets: [
    { id: 'intraday', name: 'Zig Zag (intraday, 1%)', shortName: 'ZZ 1%', inputs: { deviation: 1 } },
    { id: 'major', name: 'Zig Zag (major swings, 10%)', shortName: 'ZZ 10%', inputs: { deviation: 10, depth: 20 } },
  ],
  docs: {
    overview: 'Zig Zag connects the swing highs and lows of the chart and ignores every move smaller than the deviation. A swing high is a bar whose high stands above the highs of the bars around it (half the depth on each side); a swing low is the mirror image. Swings alternate: a new swing in the other direction counts only once price has moved at least the deviation percent from the last swing, and a higher high (or lower low) in the same direction moves the last swing there.\n\nThe result is the market\'s skeleton: the legs traders measure for trend structure, retracements and wave counts.',
    howToRead: 'Higher swing highs and higher swing lows describe an uptrend, lower highs and lower lows a downtrend; a break of that sequence is the first sign the structure is changing. The length and duration of the legs show whether moves with the trend are getting stronger or weaker than the pullbacks against it.\n\nZig Zag looks back by construction: a swing is confirmed only half the depth bars after it printed, so the line ends at the last confirmed swing, not at the current price. That last leg can repaint: its end moves while price keeps extending in the same direction, until a swing the other way is confirmed. Use the line for structure, not as a signal.',
    settings: 'Deviation sets how big a move must be to count as a new swing. The default of 5 percent suits daily charts; on intraday charts use 0.5 to 2 percent (the intraday preset uses 1 percent), or the line shows only a few legs. Depth sets how many bars a swing must stand out against; the default of 10 (5 on each side, never fewer than 2) follows TradingView.\n\nThe first swing appears once half the depth bars have printed after it. New swings are confirmed when a bar closes.',
    notes: 'Follows TradingView\'s Zig Zag: swings are highs and lows that stand out against half the depth bars on each side, a turn needs a move of the deviation percent in its own direction, and the last swing moves to a more extreme price in the same direction. When one bar is both a swing high and a swing low, the turn away from the last swing is tried first, and the bar counts once. TradingView can also extend the line to the current bar; this indicator draws confirmed swings only. MetaTrader\'s ZigZag uses a backstep instead and can differ on fast, choppy legs.',
  },
  calculate(ctx) {
    const { bars, inputs } = ctx;
    const zigZag = new Array(bars.length).fill(null);
    for (const pivot of zigZagPivots(bars, inputs.depth, inputs.deviation)) zigZag[pivot.index] = pivot.price;
    return { plots: { zigZag } };
  },
};

/**
 * Confirmed Zig Zag swings, oldest first: `{ index, price, isHigh }`. A swing high's high beats the
 * `depth / 2` (at least 2) older highs strictly and is not exceeded by as many newer ones (mirrored for
 * lows); swings alternate, a turn needs a move of `deviation` percent from the last swing in its own
 * direction, and a more extreme swing
 * in the same direction replaces the last one.
 */
function zigZagPivots(bars, depth, deviation) {
  const half = Math.max(2, Math.floor(depth / 2));
  const pivots = [];
  const standsOut = (index, isHigh) => {
    const value = isHigh ? bars[index].high : bars[index].low;
    for (let step = 1; step <= half; step += 1) {
      const older = isHigh ? bars[index - step].high : bars[index - step].low;
      const newer = isHigh ? bars[index + step].high : bars[index + step].low;
      if (isHigh ? older >= value || newer > value : older <= value || newer < value) return false;
    }
    return true;
  };
  const consider = (index, isHigh) => {
    const price = isHigh ? bars[index].high : bars[index].low;
    const last = pivots[pivots.length - 1];
    if (!last) {
      pivots.push({ index, price, isHigh });
    } else if (last.isHigh === isHigh) {
      if (isHigh ? price > last.price : price < last.price) {
        last.index = index;
        last.price = price;
      }
    } else if (index !== last.index && (isHigh ? price - last.price : last.price - price) / Math.abs(last.price) * 100 >= deviation) {
      pivots.push({ index, price, isHigh });
    }
  };
  for (let index = half; index + half < bars.length; index += 1) {
    const high = standsOut(index, true);
    const low = standsOut(index, false);
    if (high && low) {
      // Try the turn first: after a swing high the low, otherwise the high.
      const lastIsHigh = pivots.length > 0 && pivots[pivots.length - 1].isHigh;
      consider(index, !lastIsHigh);
      consider(index, lastIsHigh);
    } else if (high) {
      consider(index, true);
    } else if (low) {
      consider(index, false);
    }
  }
  return pivots;
}
Adapt it with an LLM
Paste this into your assistant and replace the second-to-last line with the change you want.
Start from this Spectral custom indicator: https://spectral.trade/indicators/zig-zag.js
Format reference: https://spectral.trade/docs/custom-indicators.llm.md
Keep the file format and every rule of the reference; give the result a new id, name, shortName and version, and update docs and input descriptions to match.
Keep its live updates exact and fast (section "Fast live updates" of the reference): carry values from bar to bar only through ctx.ta, and raise live.lookback if the change reads further back; Spectral rejects a file whose live updates differ from a full recalculation or are too slow.
Change I want: <describe the change>
Answer with the complete file in one code block, ready to save as <id>.js.
Related indicators
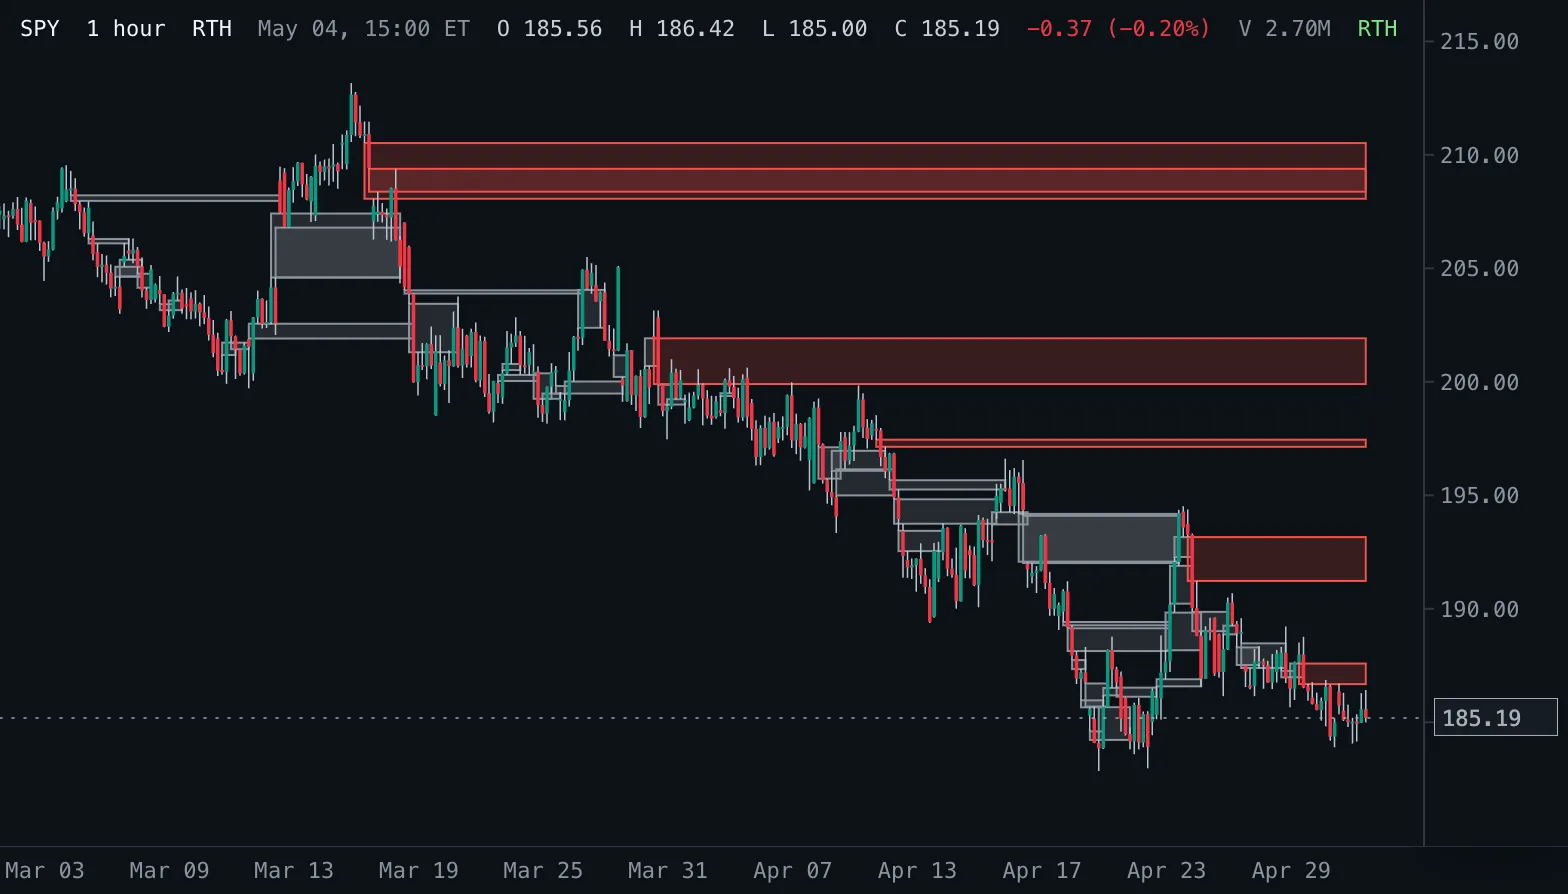
Fair Value Gaps FVG
Boxes every three-bar fair value gap from its first bar until price fills (or touches) it, labelled with the gap size; hovering a box shows its size in percent and whether it is still open.
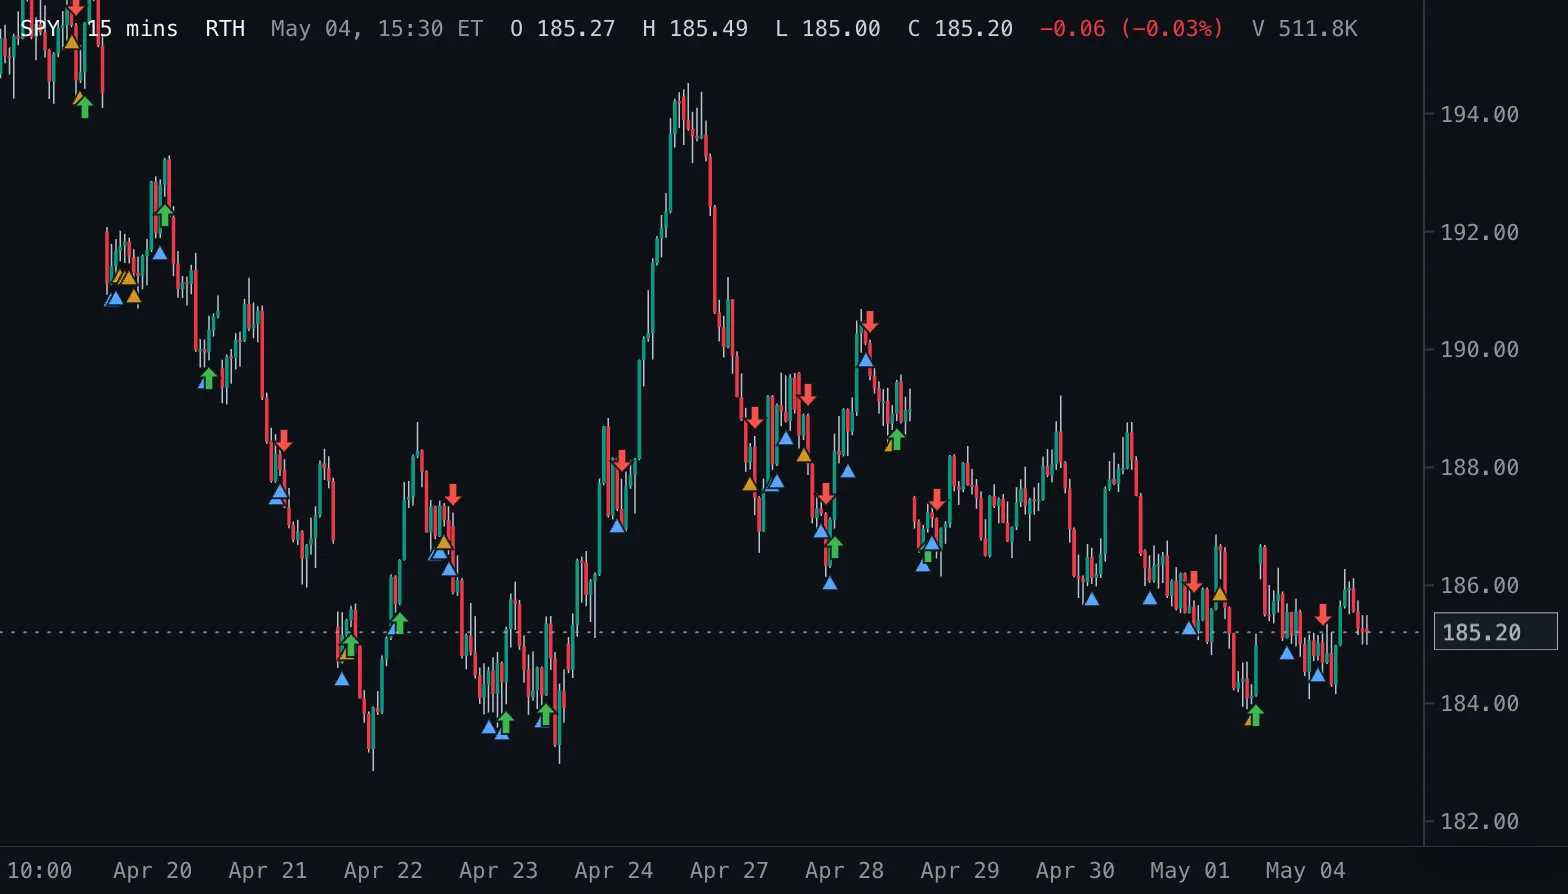
Inside Bar Breakouts IB Break
Marks inside bars with a triangle below the bar and the first close beyond the mother bar with an arrow.
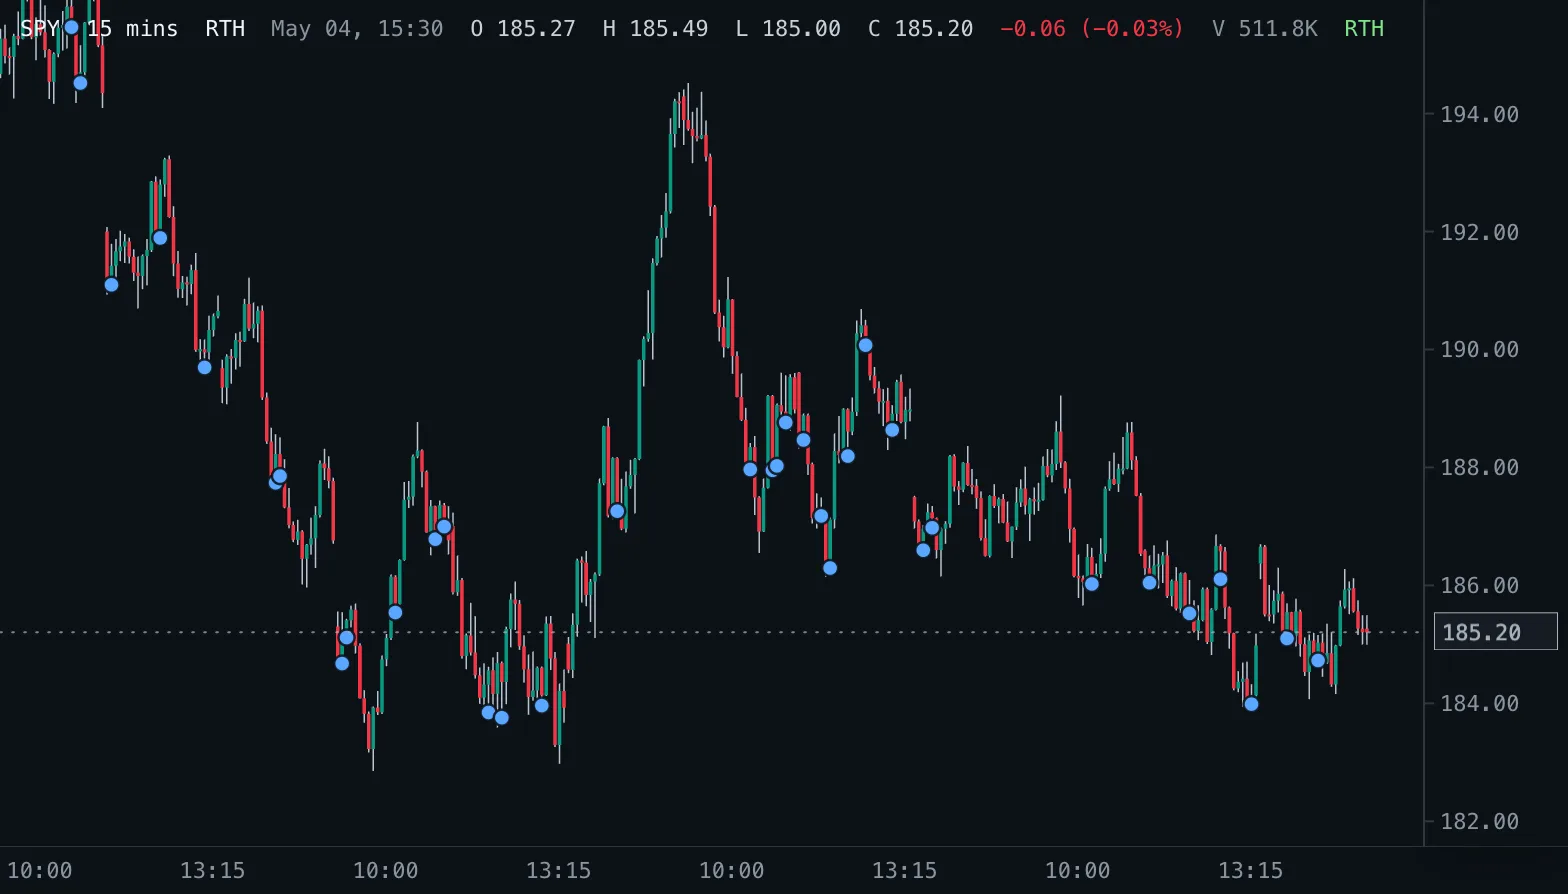
Inside Bars IB
Marks completed bars whose high and low sit inside the previous bar.