Charts
Read price action, add indicators and drawings, and keep the active session visible in one chart workspace.
Build context without leaving the chart.
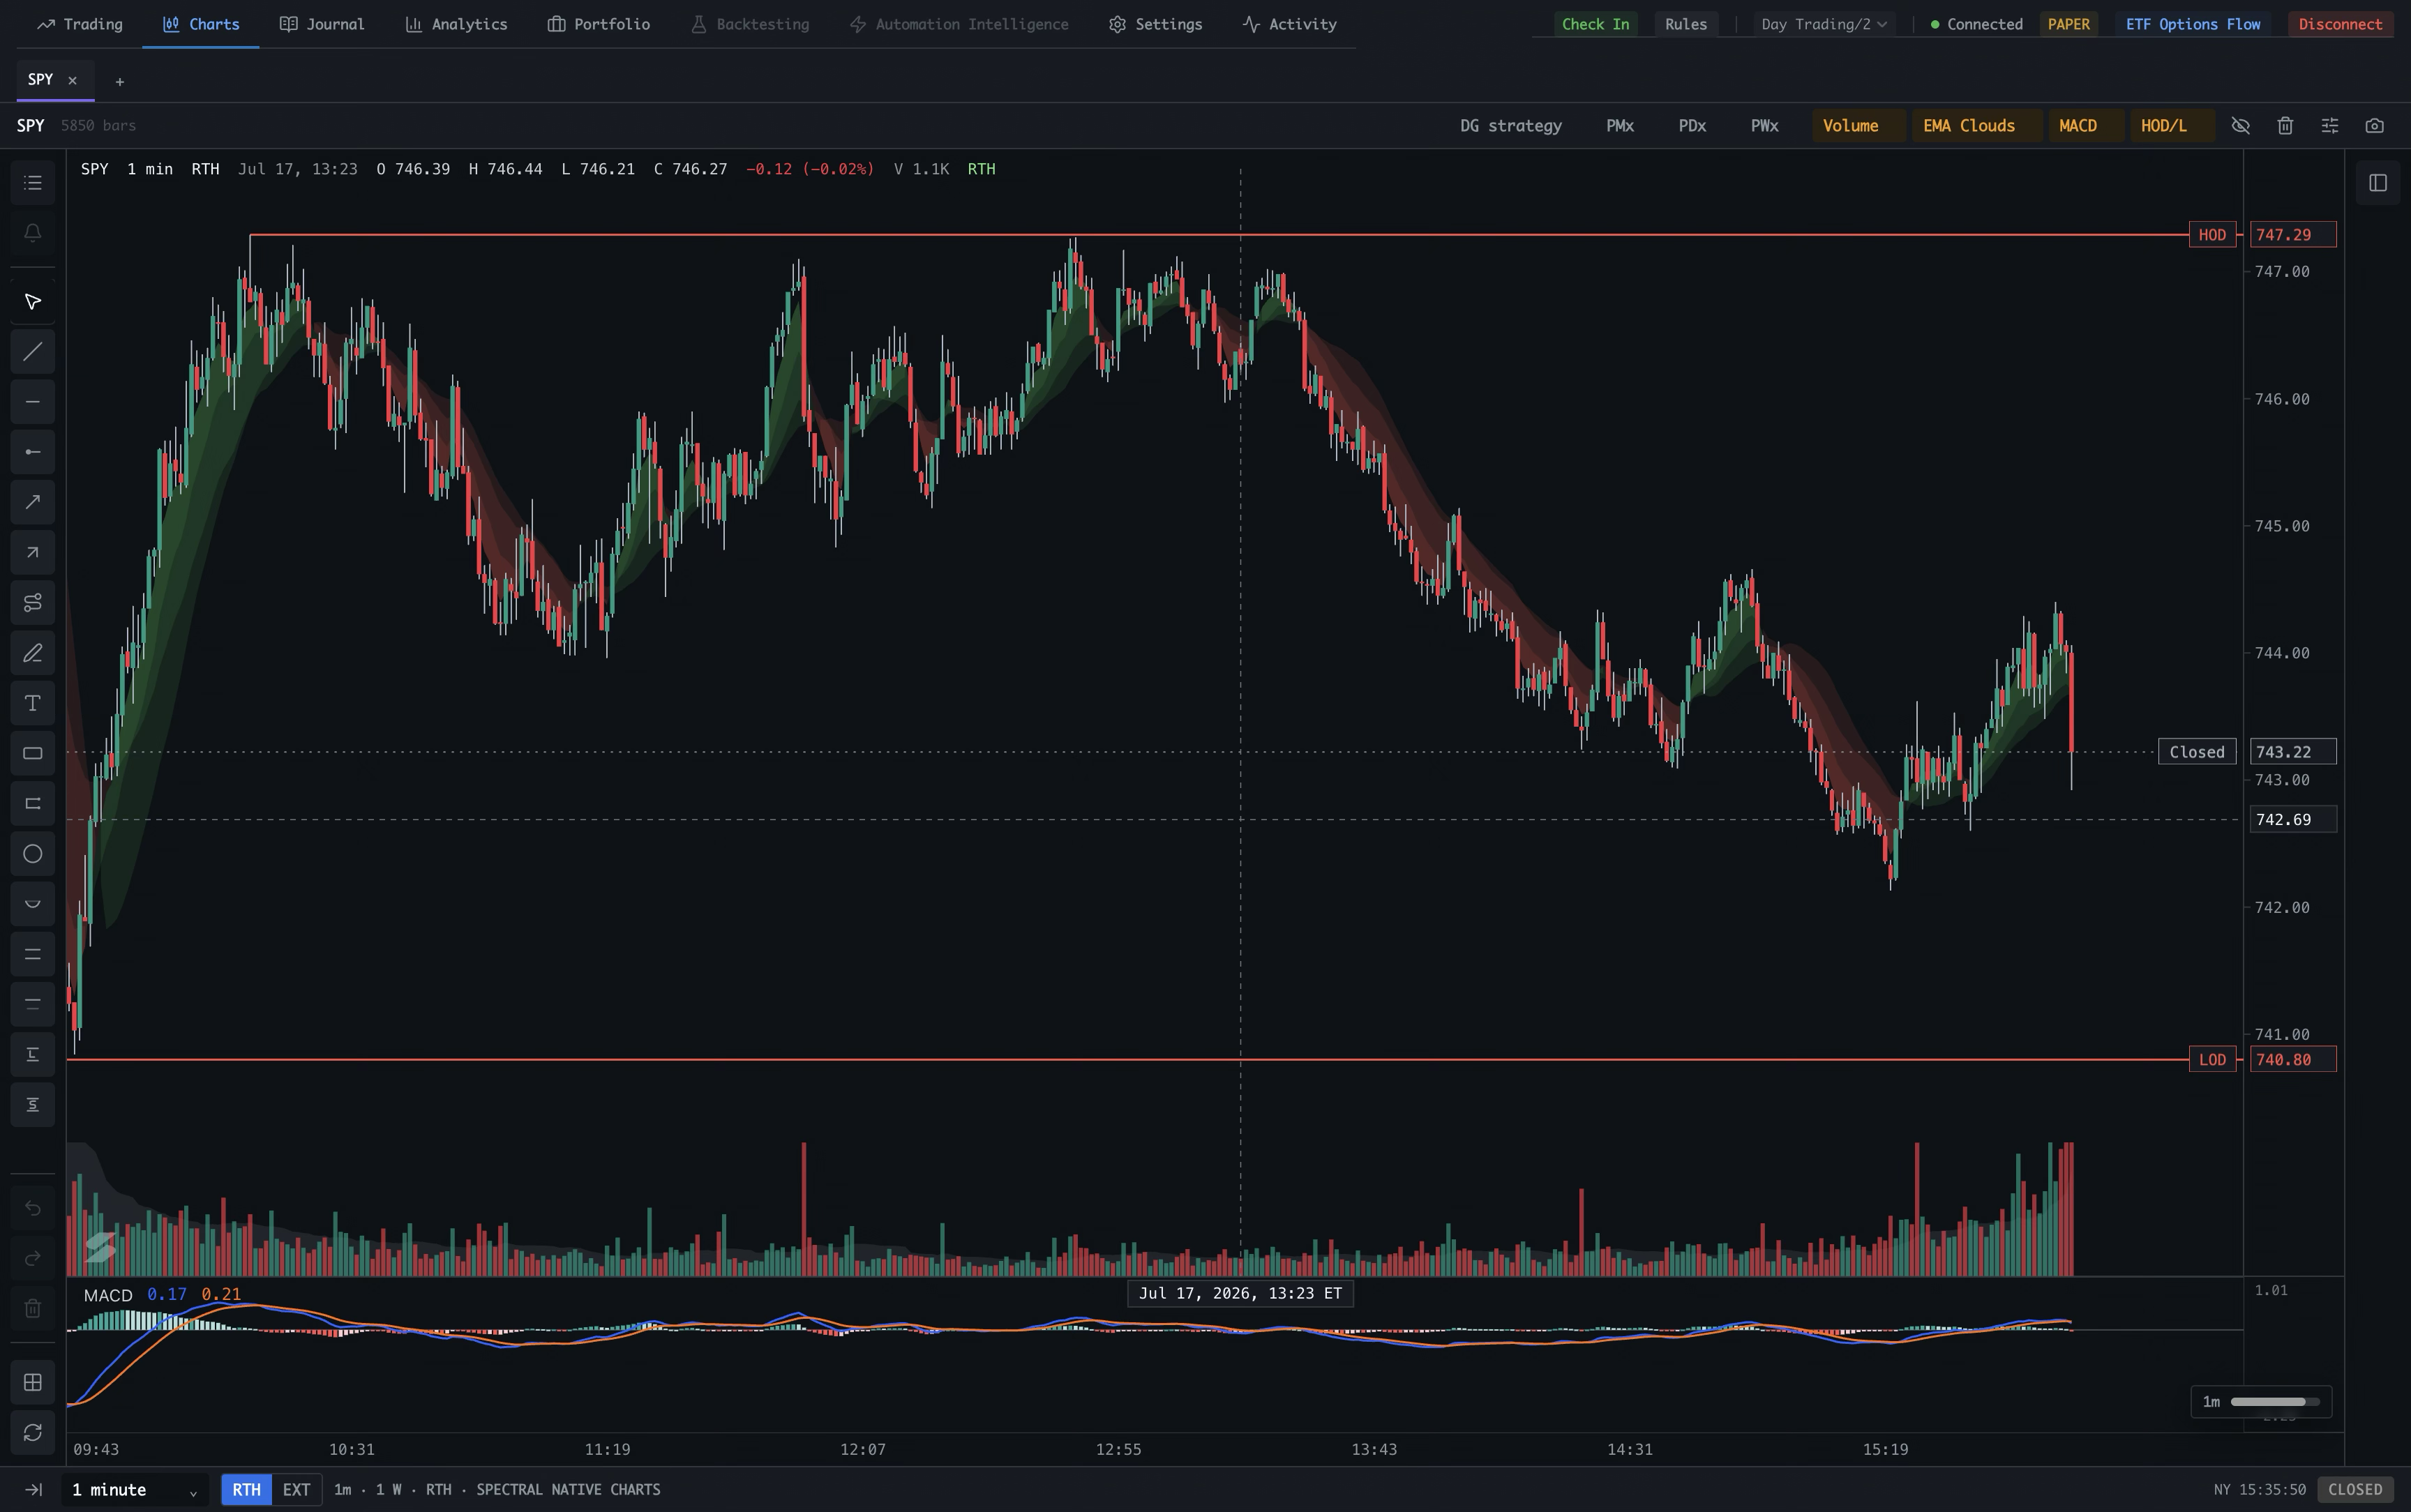
Charts keeps price action, indicators, drawing tools, and session context in one focused workspace. Use the numbered guide to orient yourself around the main controls.
Move through the workspace
The top navigation keeps Charts alongside Trading, Journal, Analytics, Portfolio, Backtesting, Automation Intelligence, Settings, and Activity. Charts is the active view here.
Choose the chart context
The chart tabs keep symbols close at hand. The header shows the active ticker, timeframe, session, date, OHLC values, change, and market-state context.
Control indicators and overlays
The upper-right controls expose saved strategy context and active indicator overlays. Visibility, delete, settings, and snapshot buttons sit beside them.
Draw directly on the chart
The left toolbar groups the chart tools: selection, lines, rays, channels, text, shapes, annotations, undo and redo. Pick a tool, then place it on the chart.
Read price action
The main panel shows the candlesticks, price scale, crosshair, session levels, and active overlays. HOD, LOD, and closed markers make important reference prices easy to spot.
Set the working timeframe
The footer keeps the candle interval, regular or extended session, timezone, data source, and market status visible. Change the timeframe here without losing the chart workspace.
From context to action. Charts is where you build the read; the rest of the Spectral workspace stays one navigation step away when it is time to review, execute, or journal.
Bundle your chart setup.
Create an Indicator box from the indicators you use together, then apply the complete bundle to any chart in one click.
Select the indicators
Choose the indicators that belong together in your charting workflow.
Create the box
Save the selected indicators as one reusable Indicator box instead of rebuilding the setup each time.
Apply it anywhere
Open another chart and apply the full indicator bundle in one click.
One box, one click. Keep your preferred indicator combinations ready wherever you are reading the market.
Scan the market without losing your chart.
The Watchlist is the browsing layer of Charts. Start with Spectral’s default Universe, move through its organized groups, and open the symbols that deserve a closer look.
Open the Watchlist
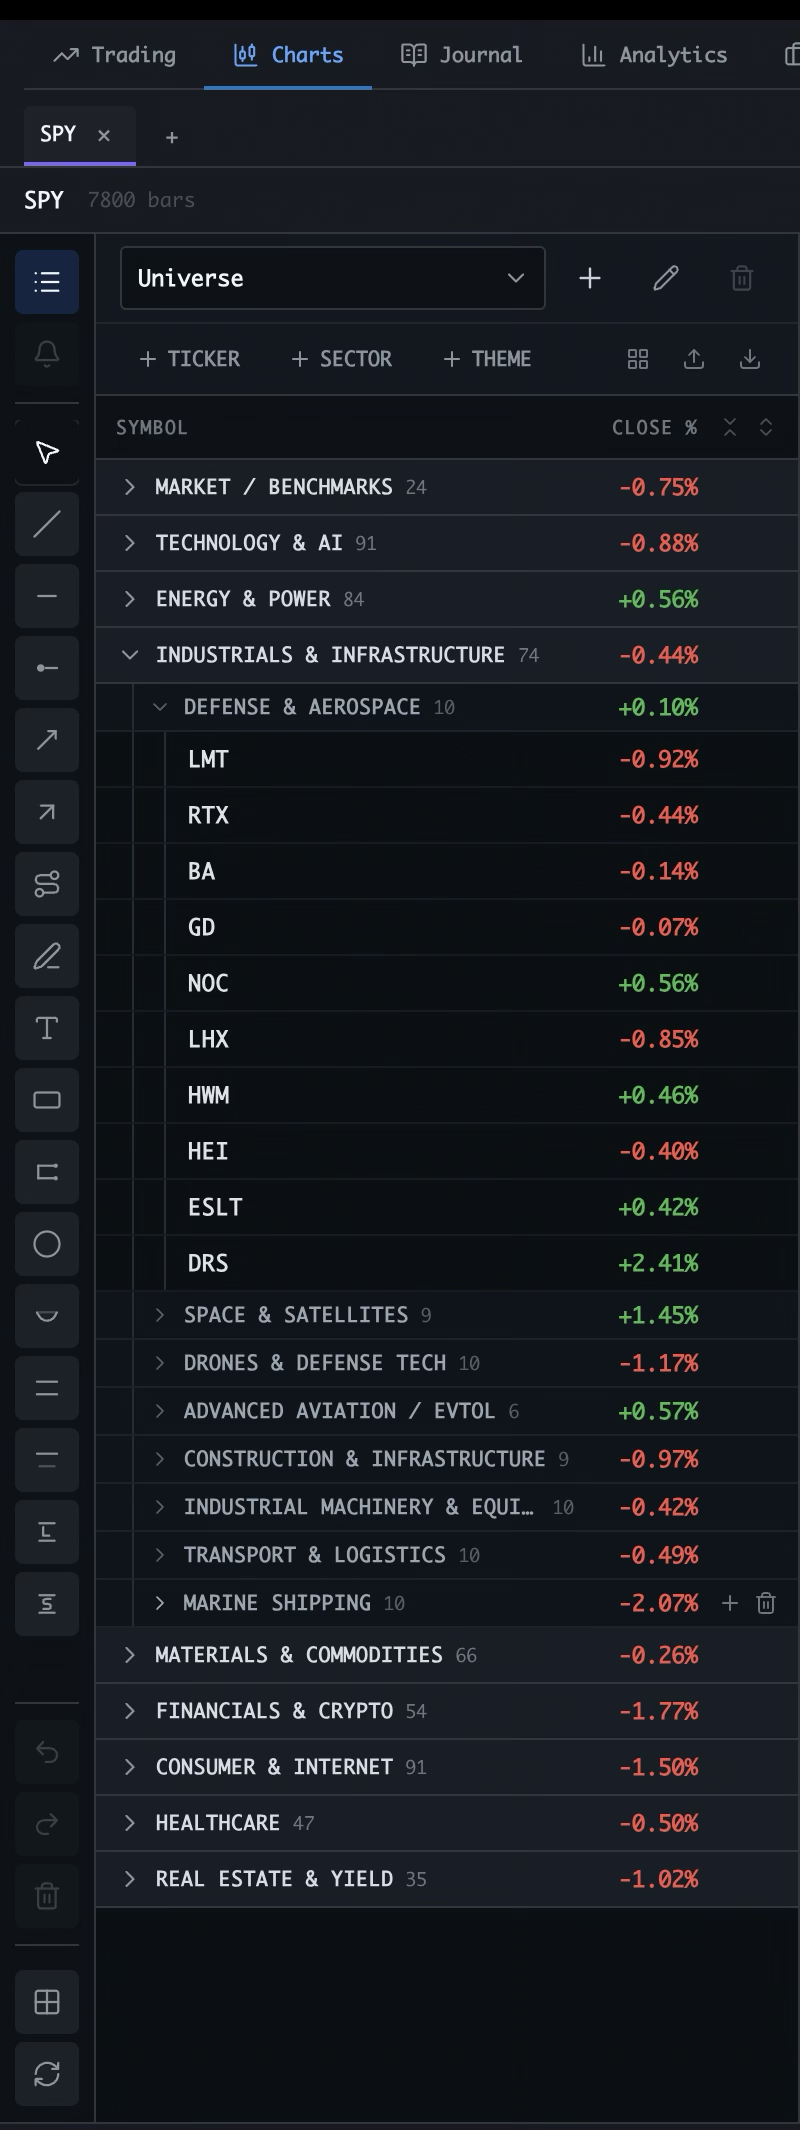
From Charts, click the list icon at the top of the left toolbar. The Watchlist opens beside the chart so you can browse symbols without leaving your workspace.
Start with Universe
Universe is Spectral’s default watchlist. It gives you a ready-made market starting point, organized into broad sectors and themes instead of one long symbol list.
Add, edit, or remove lists
Use the list controls beside the watchlist name to create a list, rename or edit the selected list, or remove it when it is no longer useful.
Build the hierarchy
Add individual tickers, sectors, or themes. This lets a watchlist hold specific symbols as well as larger groups that can be opened and reviewed together.
Expand groups when needed
The list is hierarchical: broad groups contain subgroups, and subgroups contain tickers. Expand only the branch you want to inspect, such as Defense & Aerospace inside Industrials & Infrastructure.
Read the market snapshot
Each group and ticker shows its current close percentage. Green and red values make relative movement easy to scan while you move through the universe.
Sort and change the view
Use the Symbol and Close % headers to sort the list. The view controls let you change how the watchlist is presented, while import and export controls help move list structure when needed.
Open a symbol in Charts
Select a ticker from the list to bring it into the chart workspace. The watchlist stays available as your browsing and discovery layer beside the chart.
Universe is the starting point. Keep it as a broad market map, then create focused lists around the symbols, sectors, or themes you trade most.
See where the market is moving.
Heatmap turns the active watchlist into a quick rotation map. Start broad, compare periods, then move from sectors to themes and symbols that deserve a closer read.
Read the map header
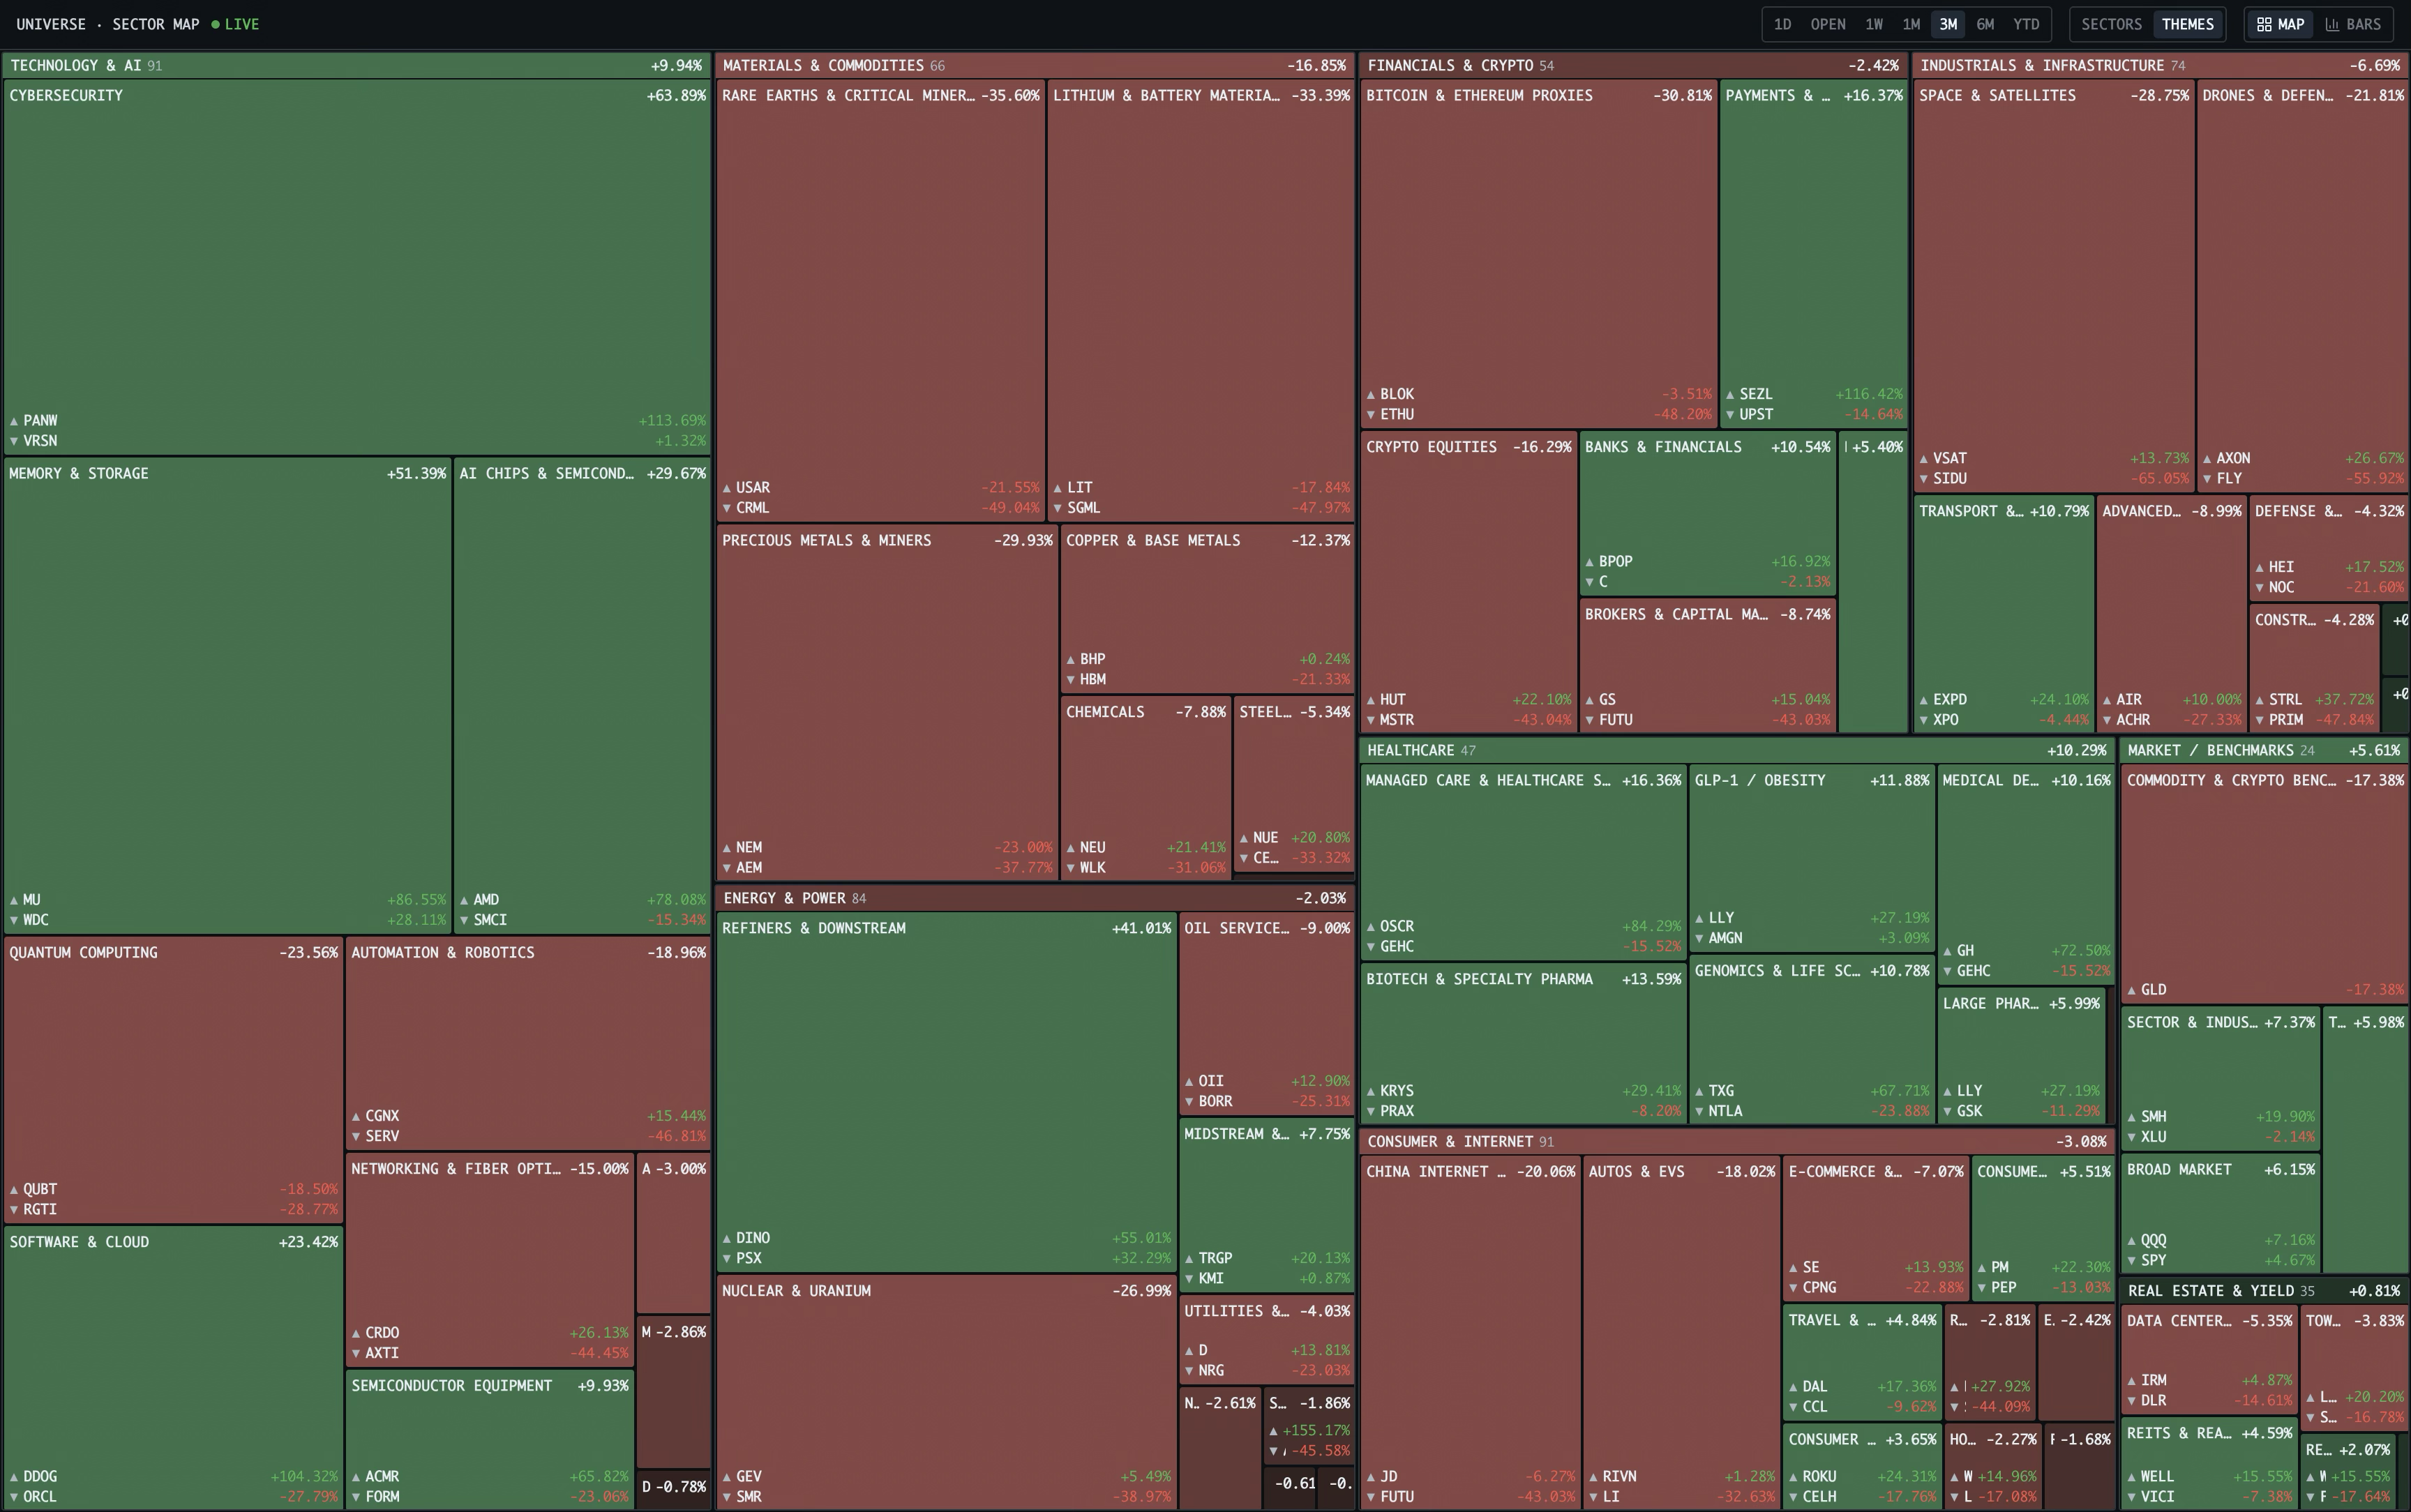
The heatmap opens from the Watchlist for the active universe. The header identifies the current watchlist, map type, and Live state before you read the tiles below.
Choose the comparison period
1D compares the current session with the prior close. Open measures the move since the session opened. 1W, 1M, 3M, 6M, and YTD compare the current price with the corresponding historical reference.
Choose sectors or themes
Sectors shows one result per sector. Themes keeps the sector containers and breaks them into their underlying themes, so you can move from broad rotation to more focused groups.
Choose Map or Bars
Map gives you a visual scan of the whole universe. Bars ranks sectors or themes on a centered positive/negative scale, which is useful when you want a clearer comparison of leaders and laggards.
Read the group result
Each sector and theme shows its symbol count and average percentage change across the symbols it contains. A group’s number describes the group, not a single stock inside it.
Read color and tile size together
Green means positive movement; red means negative movement; darker color means a larger move. Tile area gives larger moves more visual weight, but it is not market capitalization, position size, or a buy signal.
Find the extremes inside a theme
When a theme is large enough, the small ▲ and ▼ rows surface its best and worst quoted tickers. Use them as leads for investigation, then open the symbol in Charts for the full context.
Understand Live and refresh timing
Live means the symbols have been loaded and current prices may continue updating. The heatmap is not tick-by-tick: shared IBKR data lines and pacing limits mean updates arrive in batches with a delay. The map continues updating only while its heatmap window remains open.
Use the heatmap for orientation, not prediction. It helps reveal where strength and weakness are concentrated; the chart and execution workflow provide the detail for a trade decision.